Using Lidar to Understand the Impacts of the 2025 Palisades and Eaton Fires, Los Angeles, CA
Feb 10, 2025
By Cassandra Brigham, Chelsea Scott, Christopher Crosby
On January 7th, 2025, the Palisades and Eaton fires ignited in Los Angeles County, causing destruction over a combined area of 60 square miles at the wildland-urban interface. The fires killed at least 29 people and destroyed over 16,000 homes and other buildings. Evaluating the short- and long-term impacts on burnt neighborhoods and the surrounding landscape is an essential part of the recovery effort and informs future hazard assessment and response. By comparing high-resolution 3D scans of the terrain and built environment collected before and after the fires (known as topographic differencing), scientists can see how the landscape has changed and can anticipate changes in the future.
What Is Topographic Differencing?
Lidar (short for “Light Detection and Ranging”) is a technology that uses laser pulses from an aircraft to measure the 3D shape of the Earth’s surface at high resolution (typical meter to sub-meter pixel resolution). From these measurements, researchers create detailed maps called Digital Elevation Models (DEMs). A Digital Terrain Model (DTM) shows the bare earth (ground surface), while a Digital Surface Model (DSM) includes buildings, vegetation, and other objects on the ground surface. When multiple lidar datasets are collected over an area, it offers the opportunity to examine how the landscape has changed in the intervening time period.
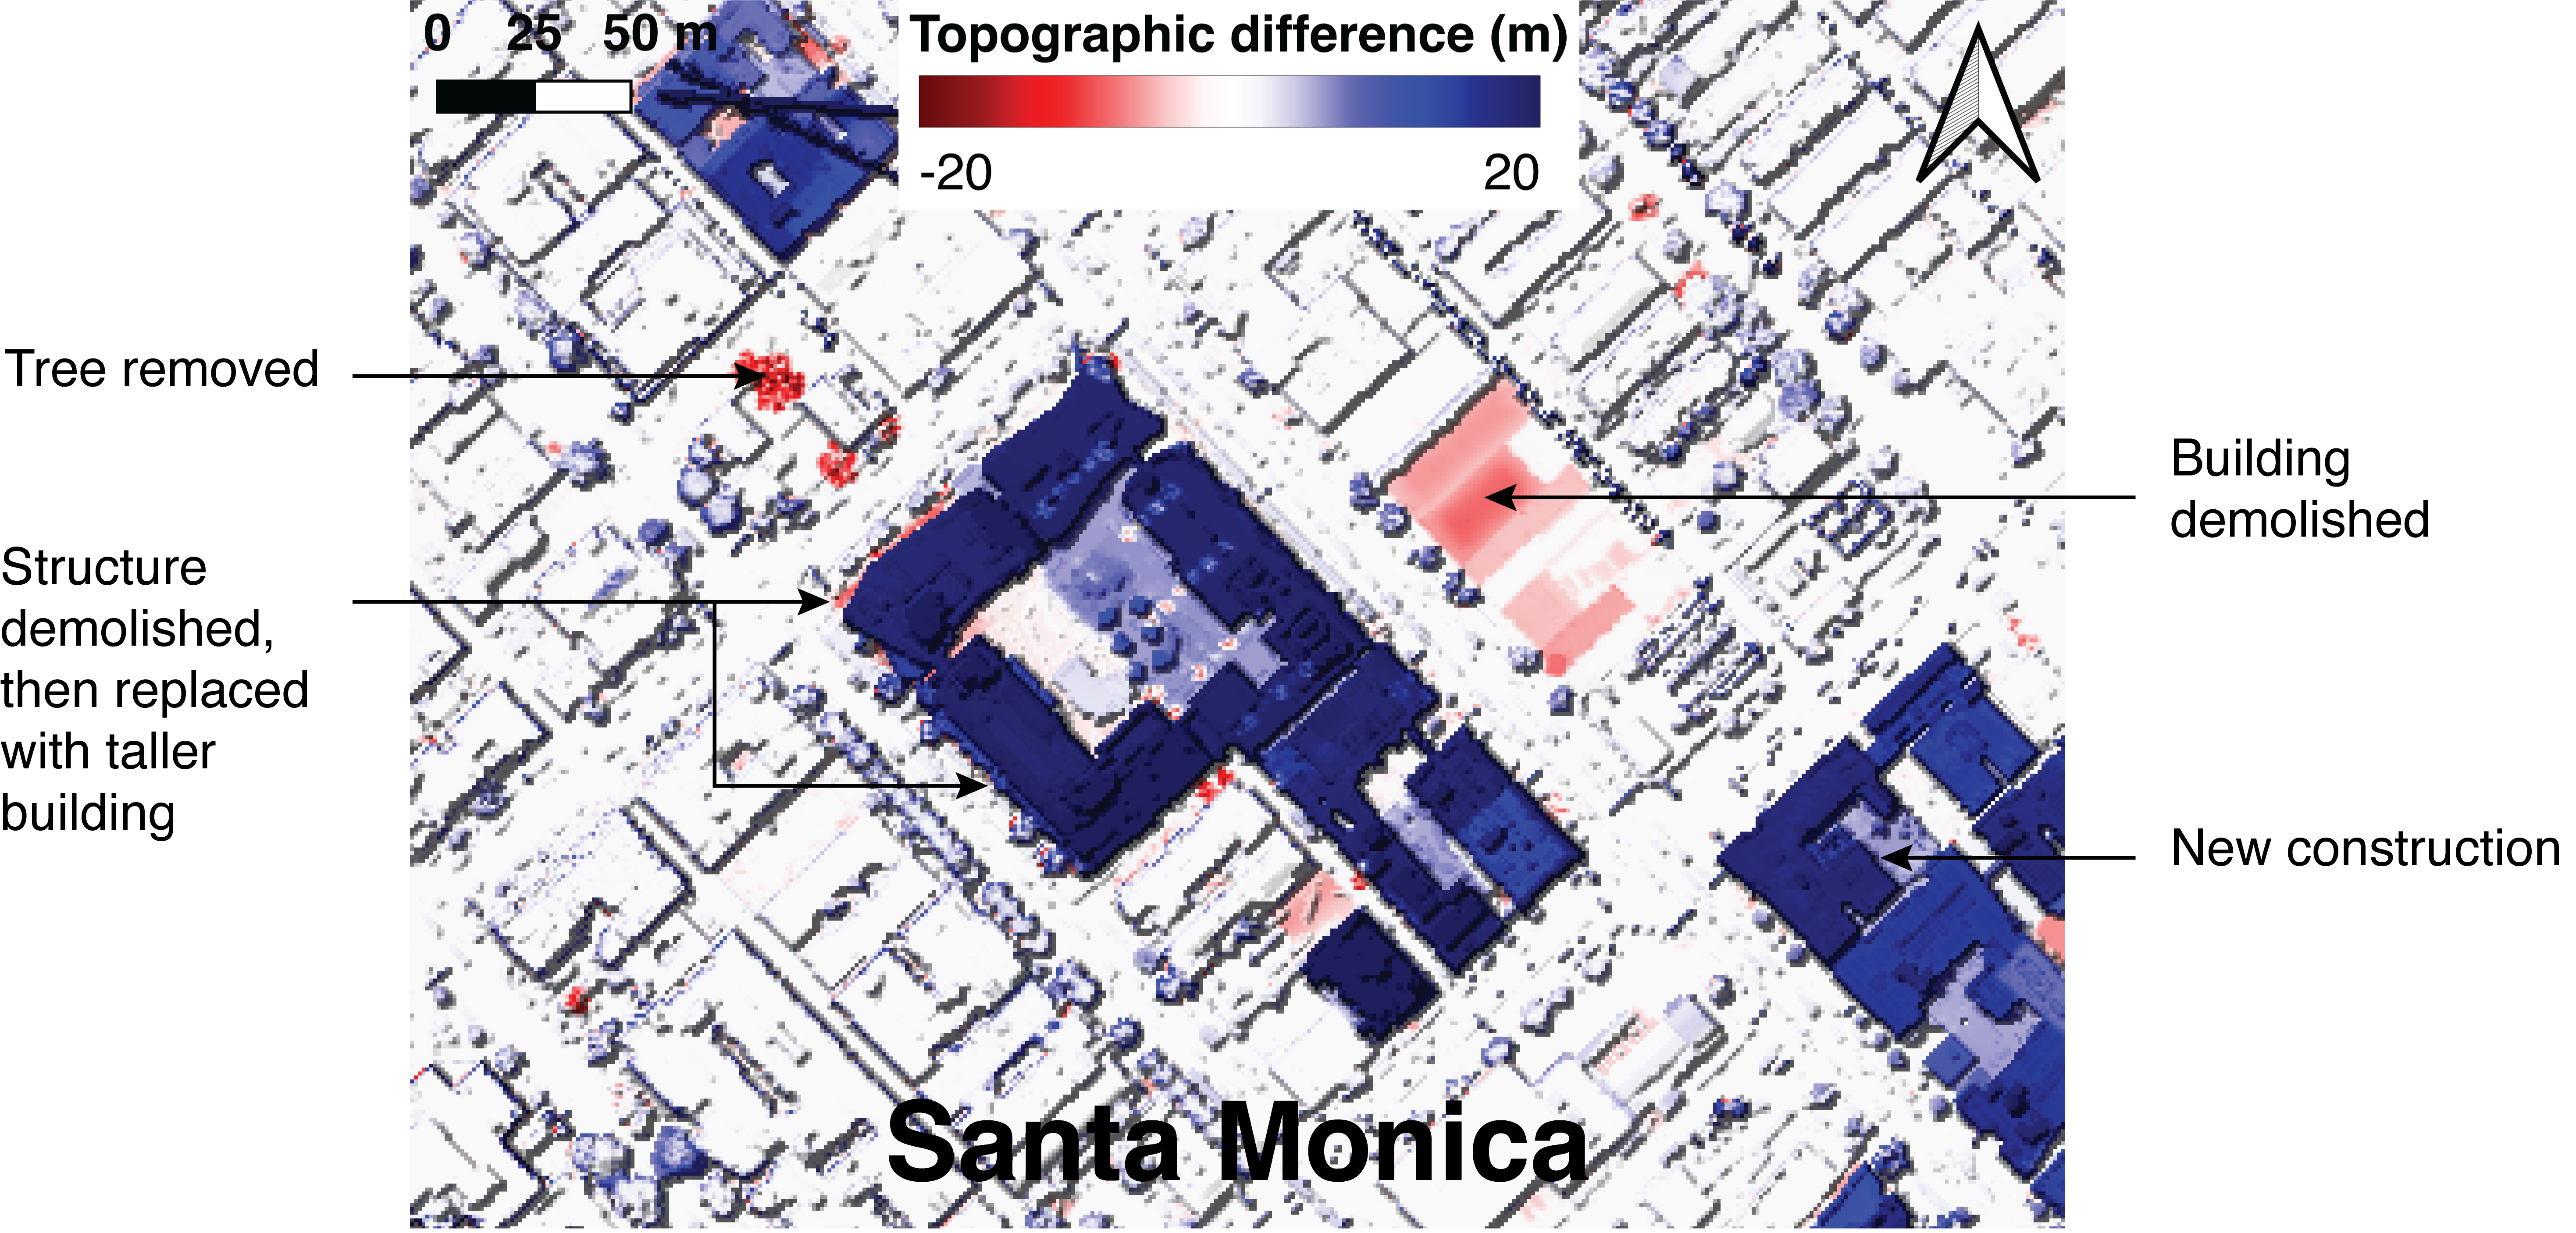
By subtracting the “before” elevation values from the “after” values, we get a meter-scale resolution map highlighting areas of significant change (such as structures that were destroyed, or vegetation that burned). Red indicates a negative difference (the post-fire terrain is lower than before). Areas in red lost elevation—this might show where buildings were destroyed or vegetation was burned, or where soil eroded away. White indicates very little or no change between the two dates. Blue indicates a positive difference (the post-fire terrain is higher than before). Areas in blue may show the natural deposition of sediment, human modification of materials, and construction of buildings and other infrastructure.
How we made the maps
1. Collecting the Data
-
Data from before the fires: The lidar data pre-dating the fires was acquired in 2016 by the U.S. Geological Survey (USGS) through their 3D Elevation Program (3DEP) and was distributed in point cloud format.
Through filtering of the raw point cloud data, we retained only the most accurate points, removing points that were not classified as surface returns and had obvious errors.
From the retained points, we created our pre-fire DTMs and DSMs at a 1-meter resolution.
More information on pre-fire point cloud data for the Los Angeles County region can be found here. -
Data from after the fires: NV5, in collaboration with the ALERTCalifornia program at UCSD, acquired post-fire lidar data between January 21 and 22, 2025.
These data were released by the USGS as preliminary 0.5-meter resolution DTMs and DSMs. The post-fire point cloud data are not available at this time.You can access these post-fire DEM datasets via OpenTopography:
2. Aligning the Datasets
If even small horizontal georeferencing errors are present, a topographic feature in one dataset will be offset from itself in the other, creating a pattern where apparent change varies with the topographic slope. To minimize this error, we took steps to horizontally shift the older 2016 map to match the newer 2025 map, used the approach outlined in Nuth and Kaab (2011) and implemented in the xDEM Python package.
3. Performing the Differencing
We subtracted the 2016 elevations from the 2025 elevations for both the DTM (bare earth) and DSM (top of buildings/vegetation). This highlights changes, whether from the fires themselves, as well as construction or natural processes like erosion in the eight-year span before the fire.
The DEMs (pre- and post-fire) used for this topographic differencing analysis, as well as additional technical details on the processing are available on OpenTopography: https://doi.org/10.5069/G95B00PW
View and explore this dataset on our interactive map.
Observations of change
Impacts on the built environment
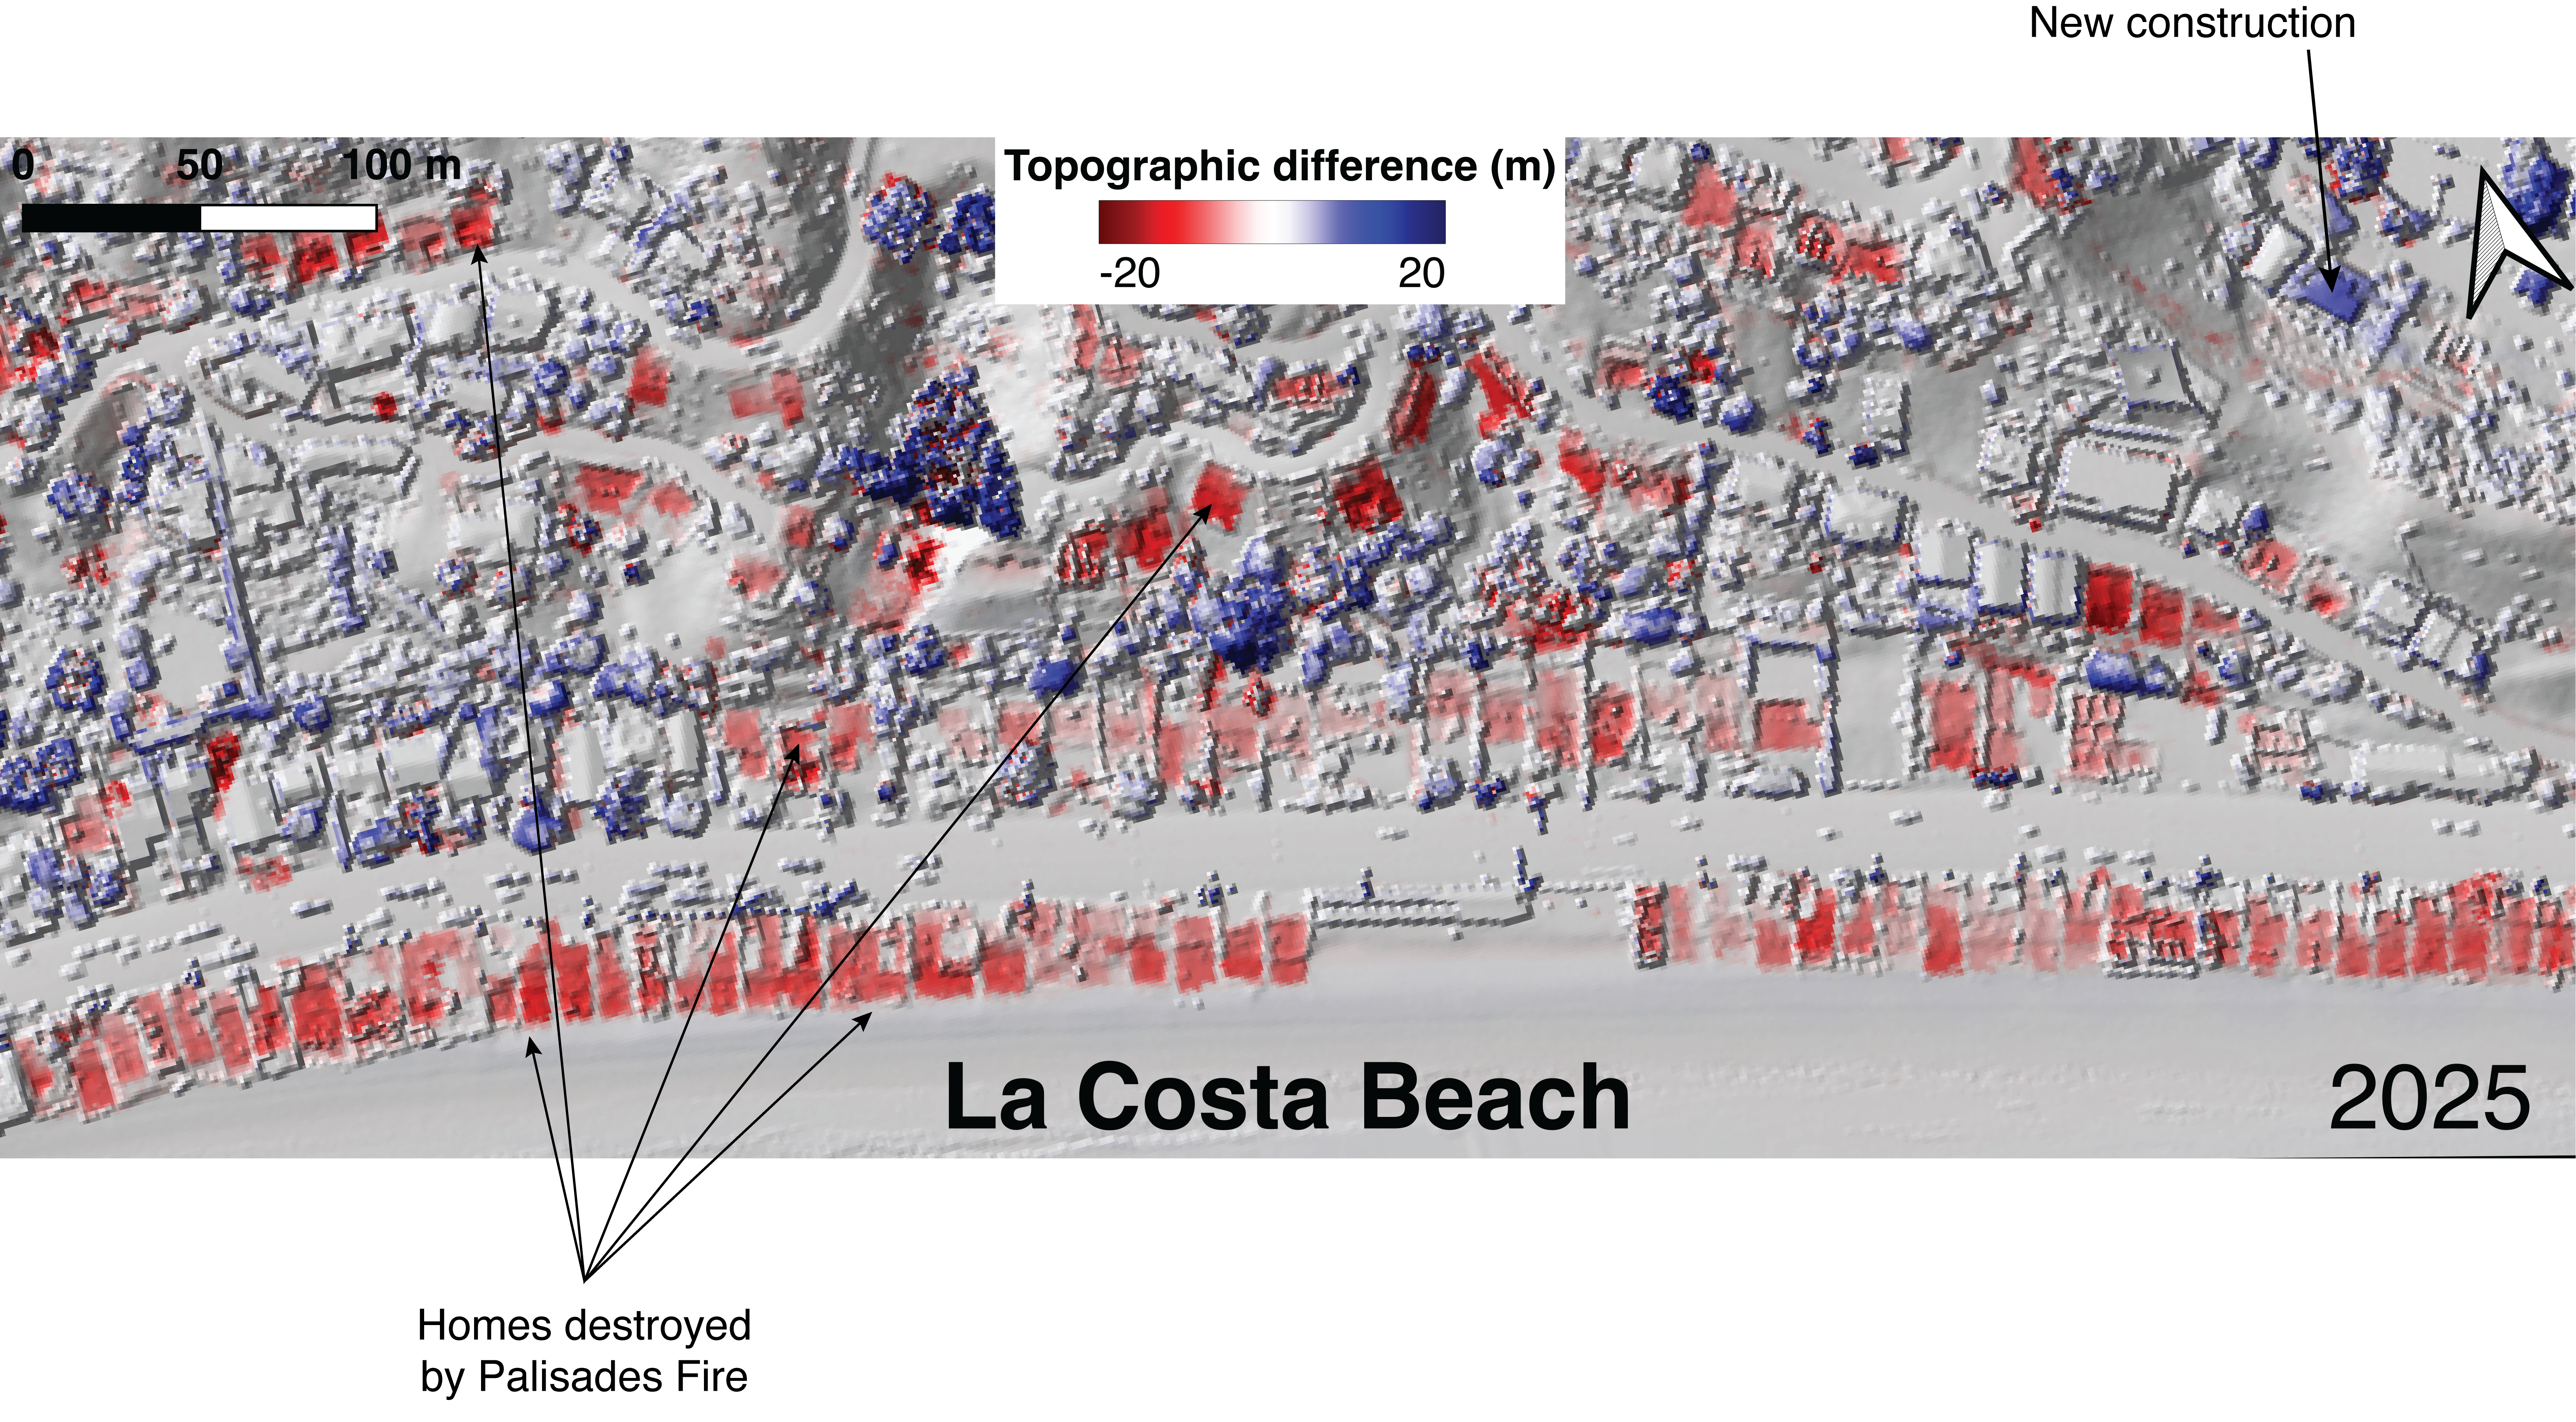
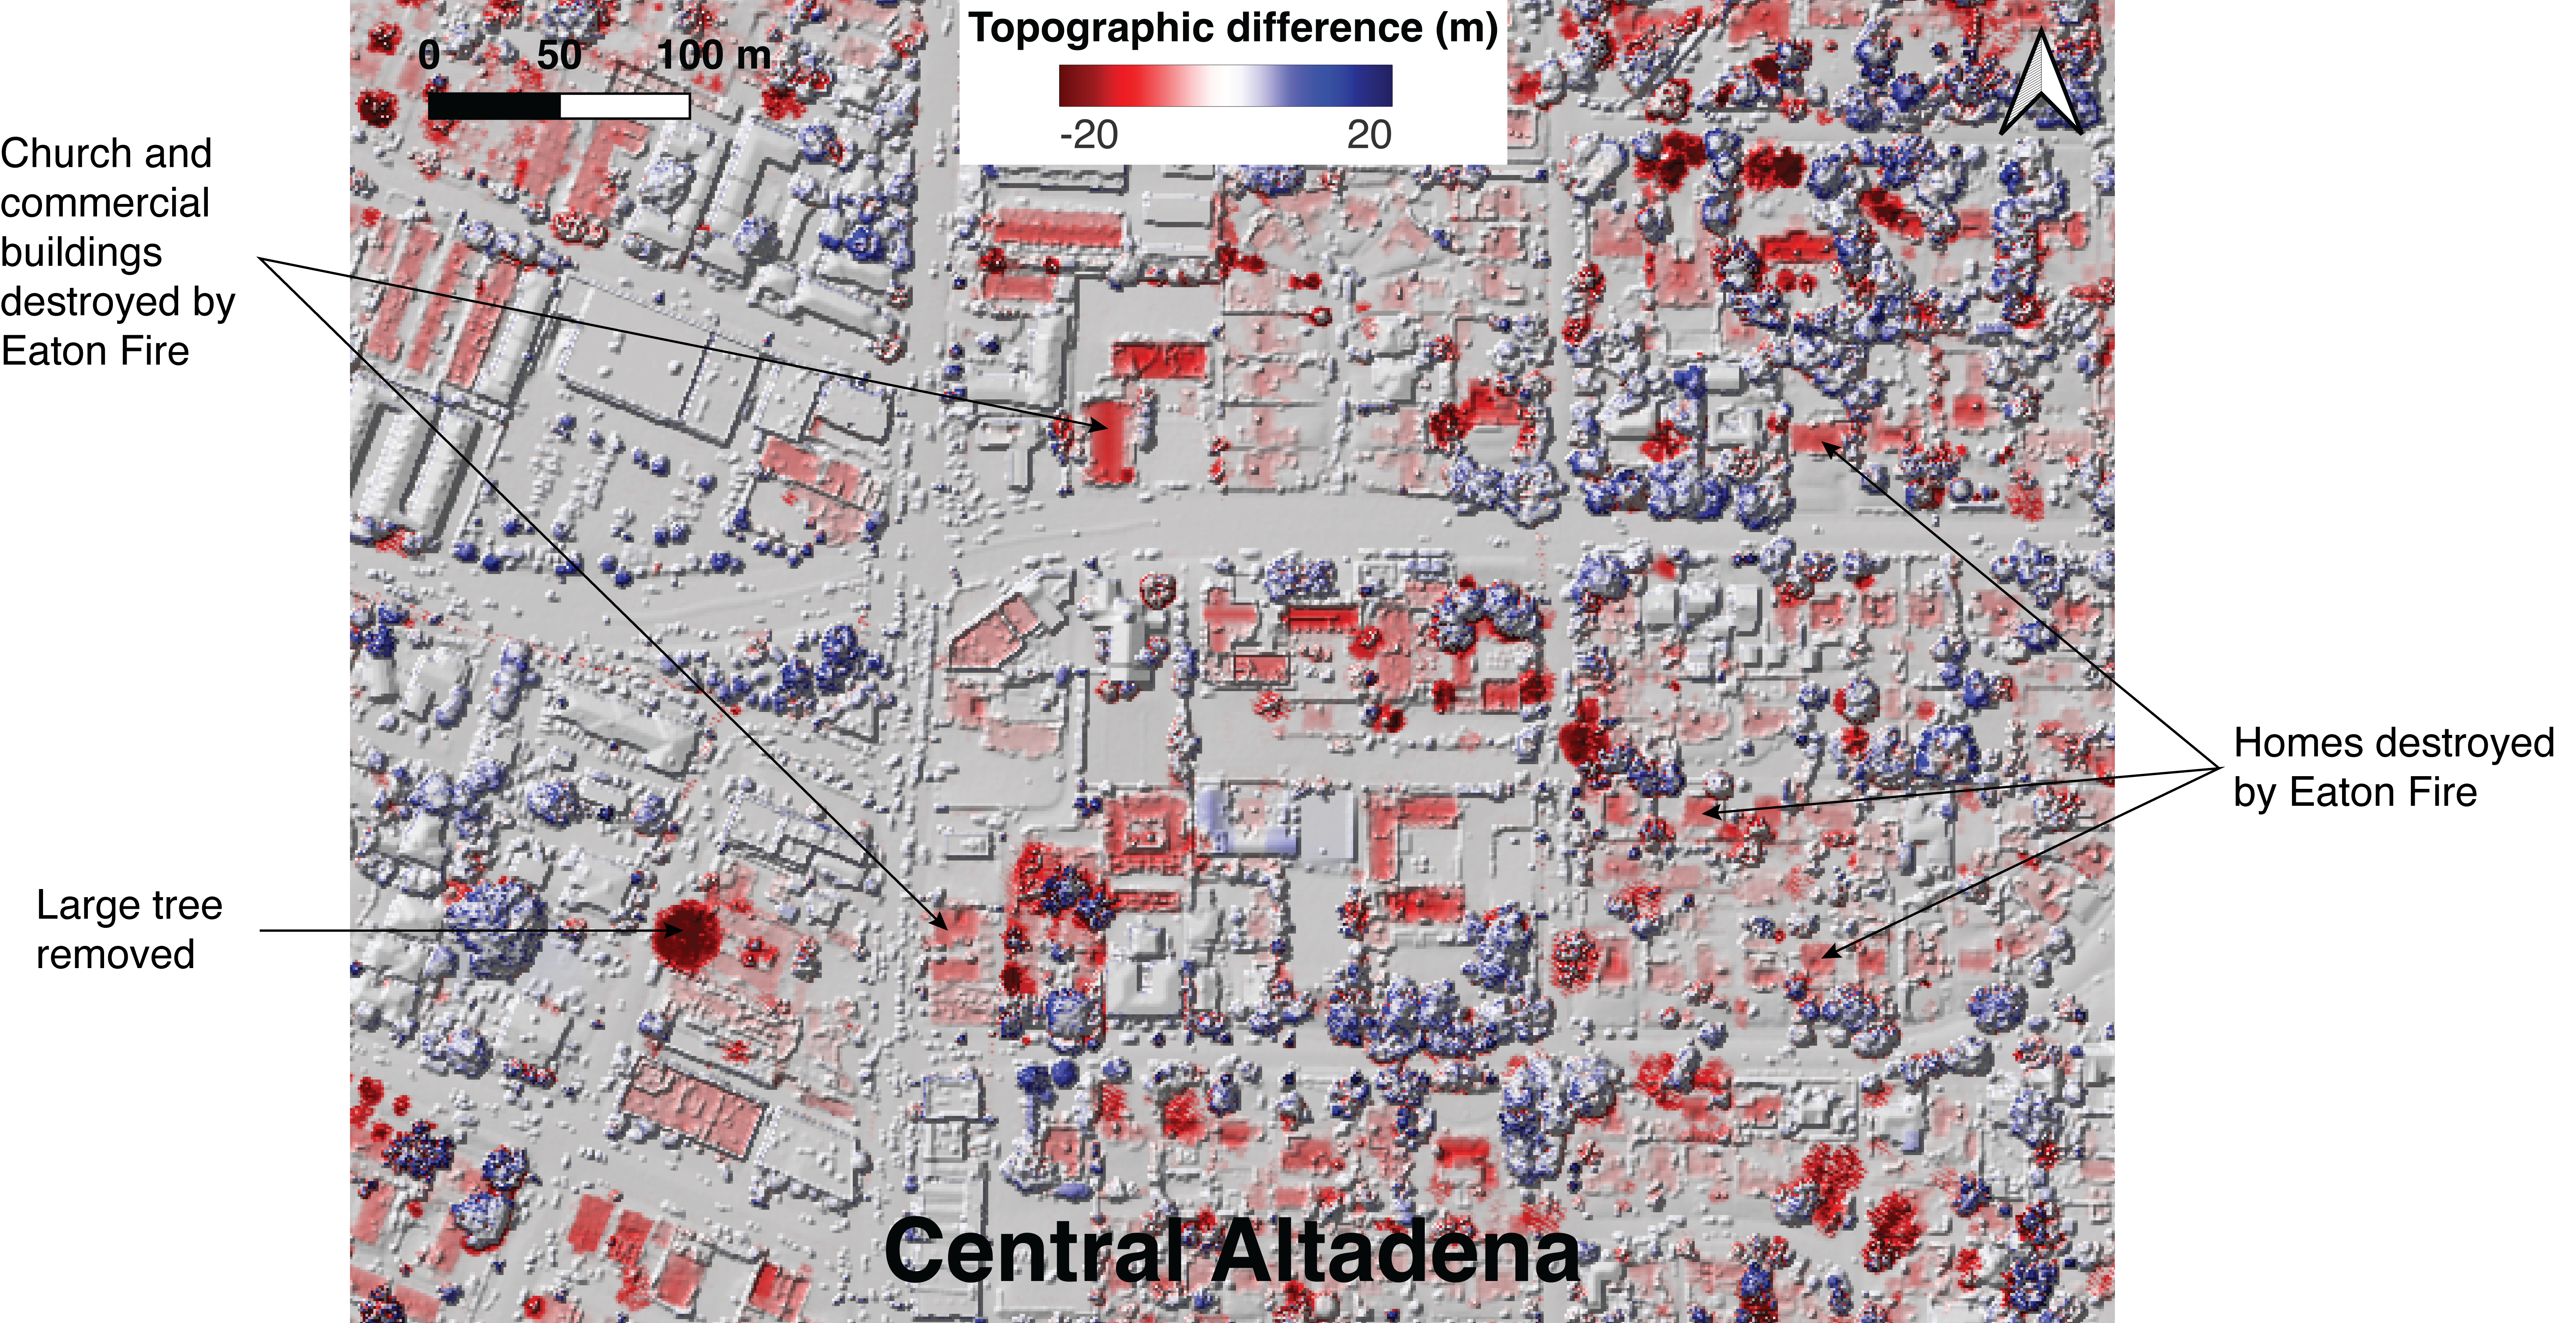
The DSM differencing results show where buildings have been severely damaged or destroyed, as shown by the rectangular red patches where the ground surface has moved down by 3 to 10 m.
Destruction of homes along the coast by the Palisades Fire
Widescale destruction across Altadena during the Eaton Fire
Impacts on vegetation
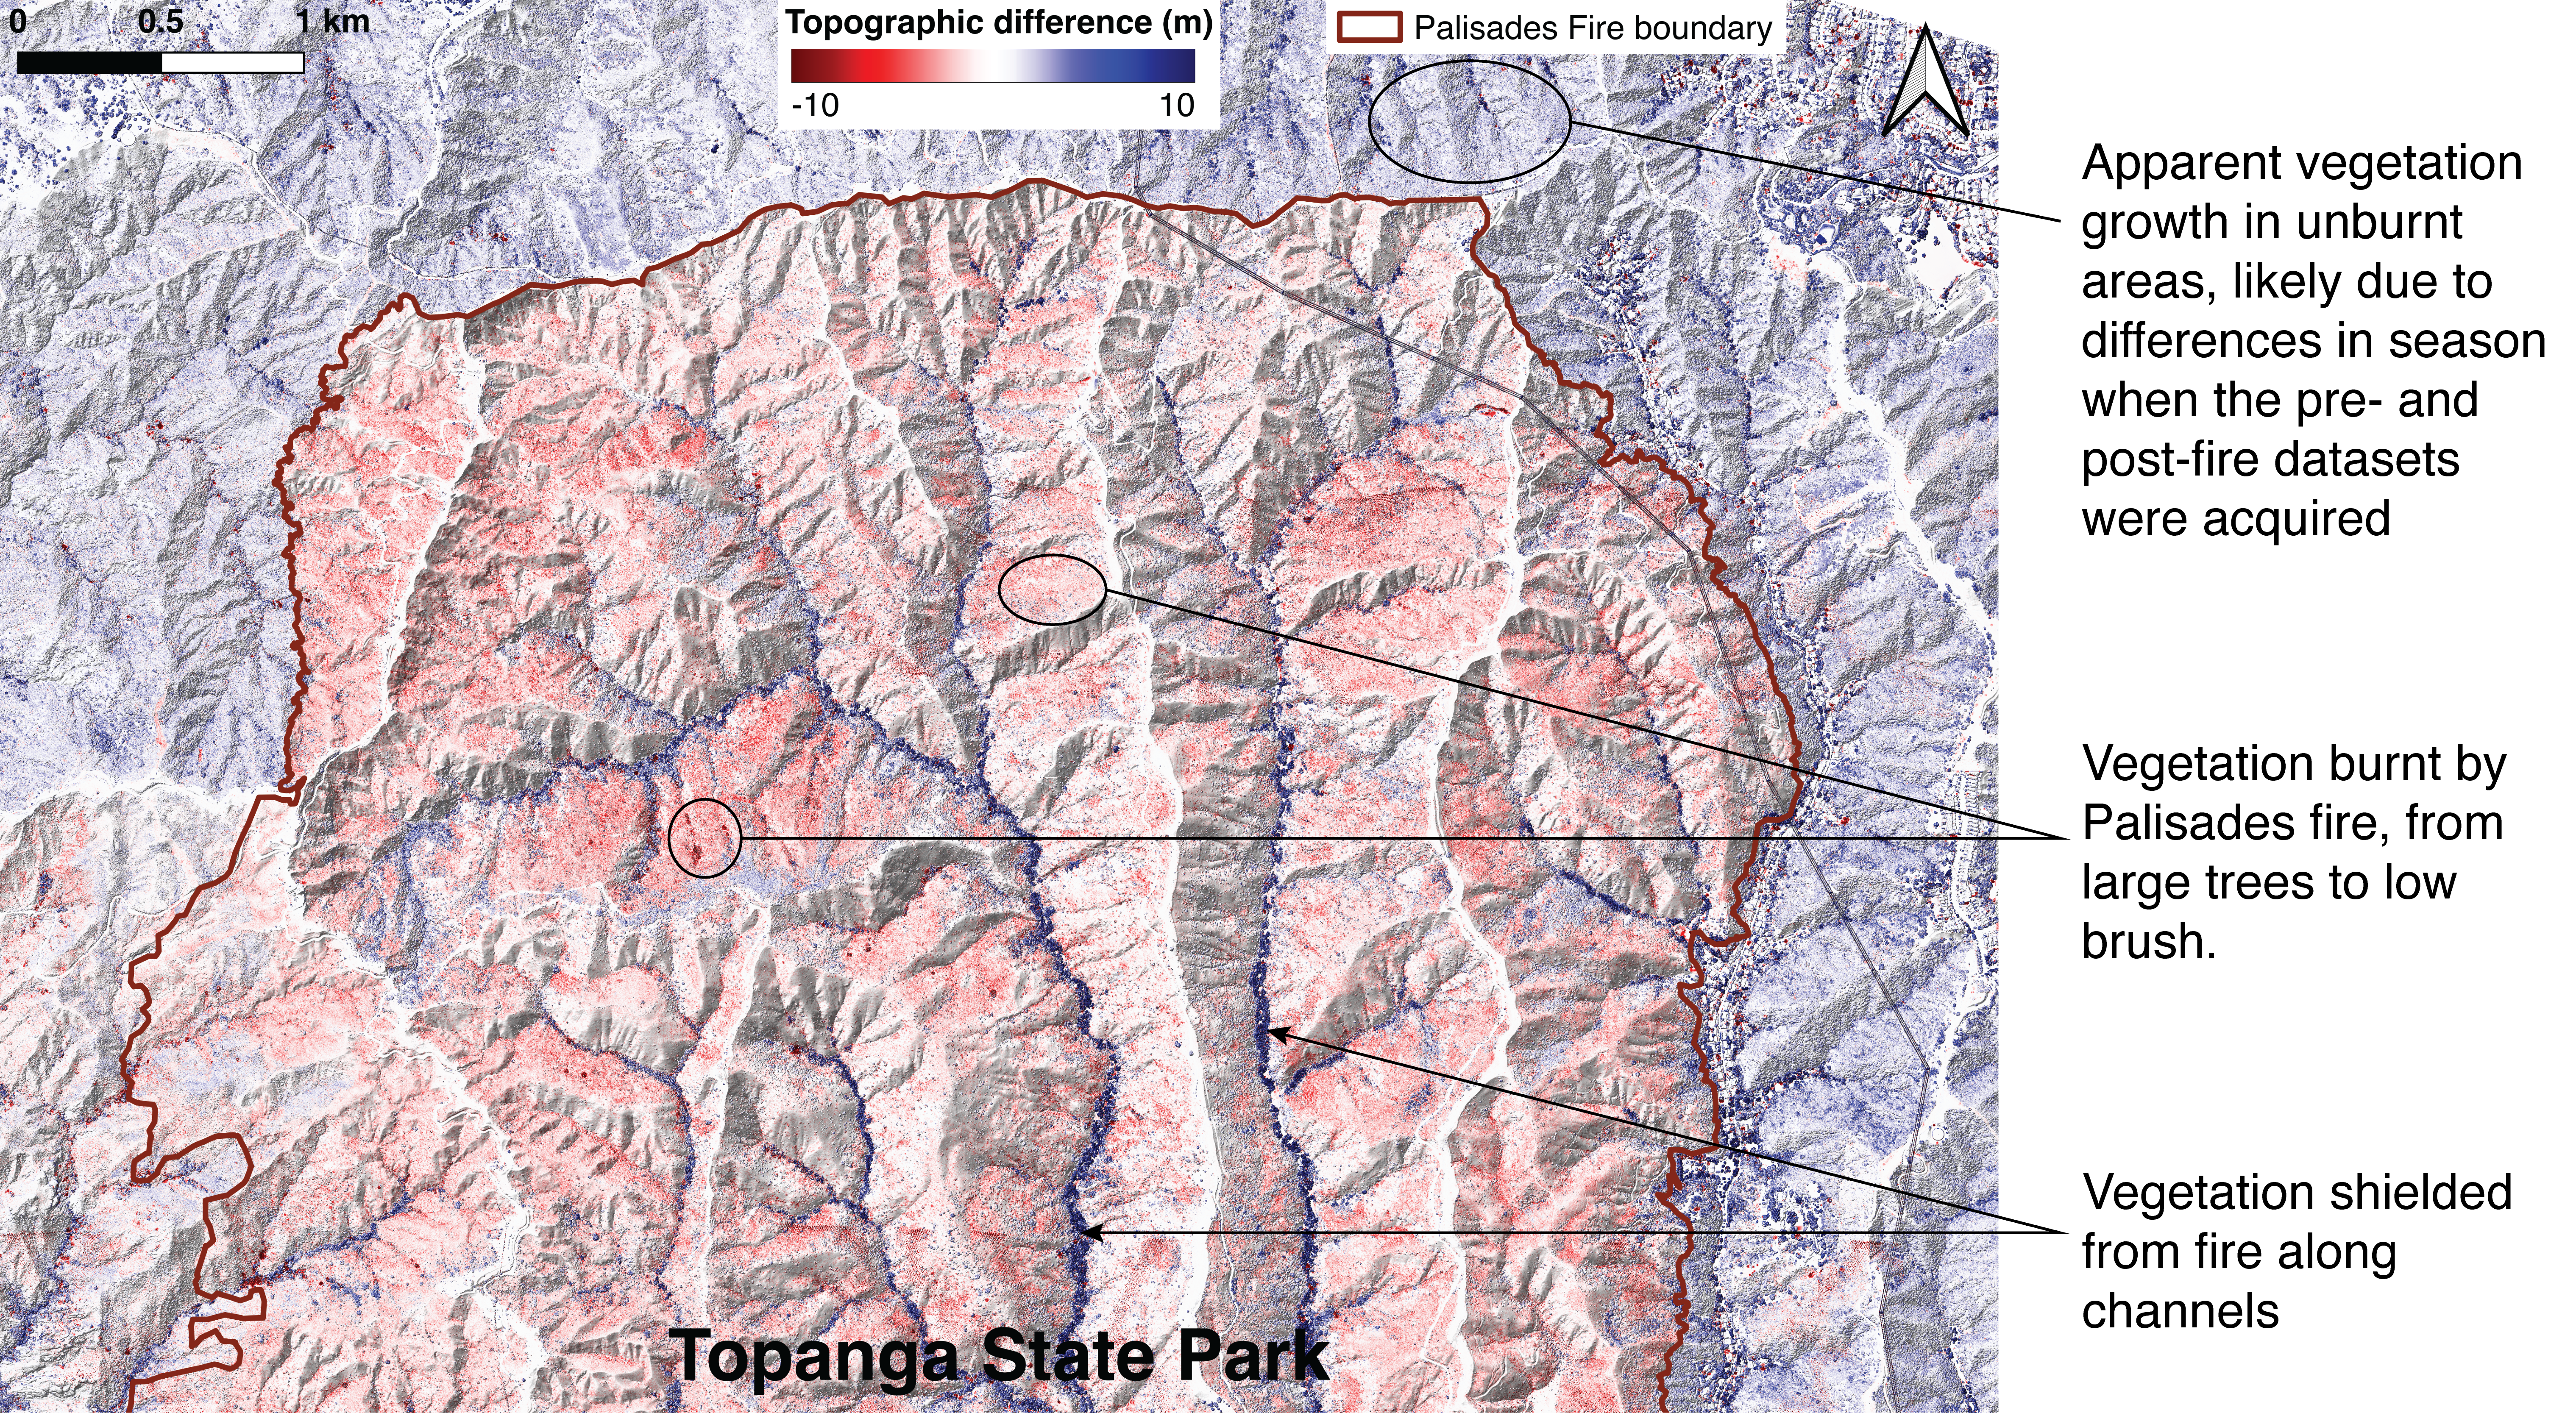
Within the fire boundaries shown in dark red, the fire has scorched the brush (0.5 to 2 m downward change over large areas) and destroyed trees (patches of downward change of 5 to 15 m). Vegetation has been shielded along the channels and on some of the NE-facing hillslopes (see Eaton differencing results). Vegetation growth over the landscape between 2016 and 2025 is shown as the blue shading of the hillsides outside of the fire boundaries.
Impacts on vegetation in Topanga State Park
Impacts on the ground surface
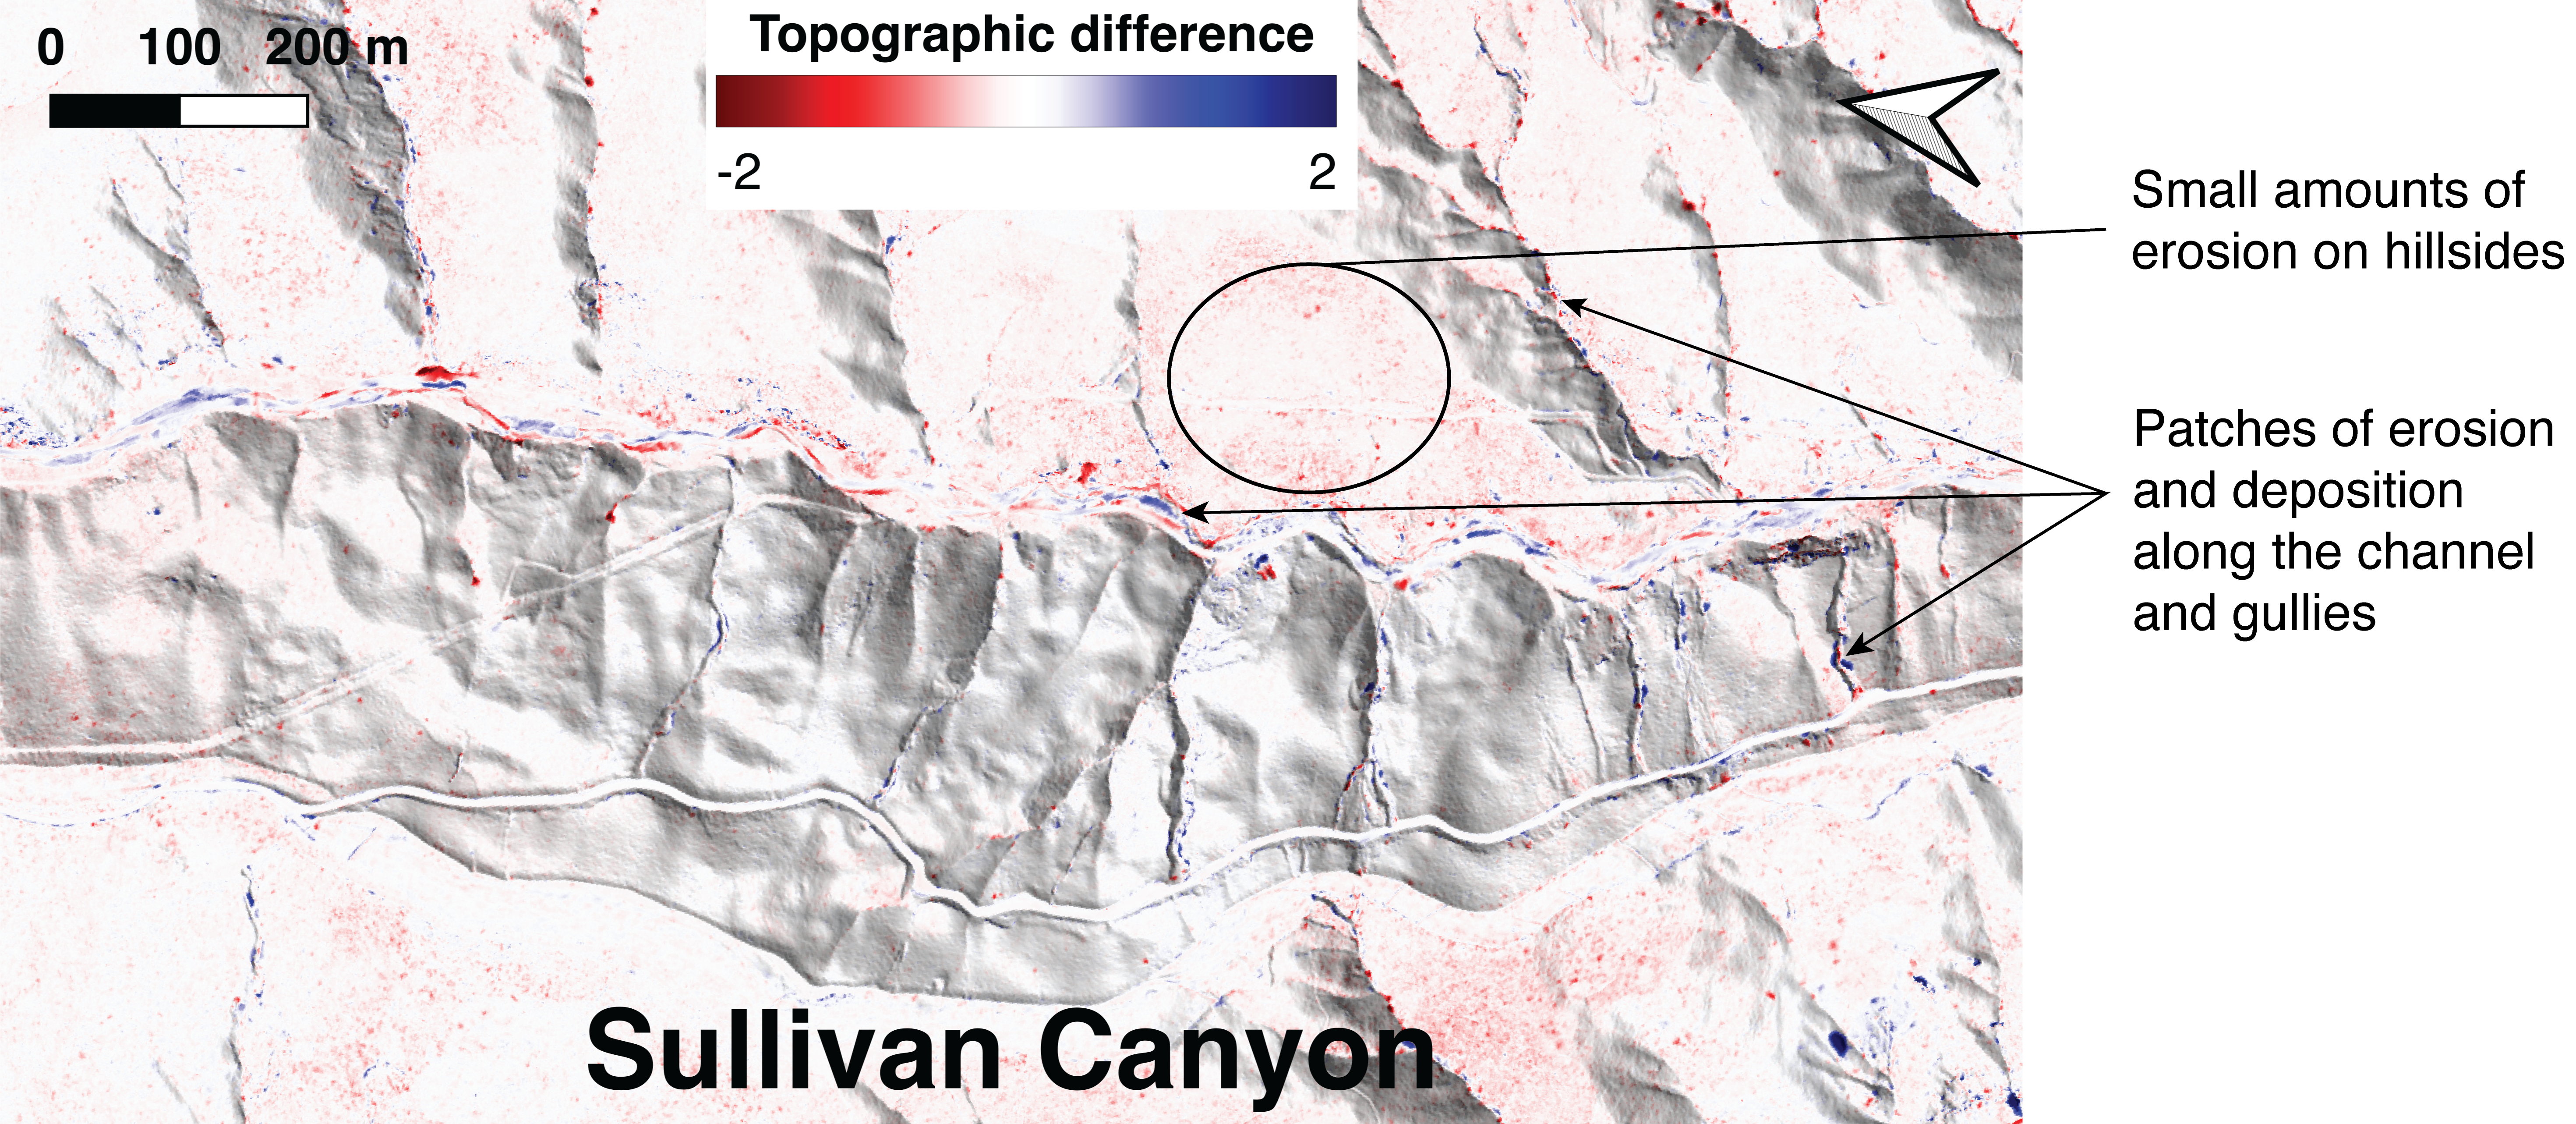
As expected, since wildfires typically impact vegetation and the built environment, the DTM differencing results do not show as strong a fire signal, but there is slight downward change (less than 1m) in hilly areas due to erosion and some sediment and rocks that have been reworked in the channels and gullies. Post-fire debris flows are a significant hazard in burned landscapes, and we would expect those events to significantly alter the bare earth topography, but in this case the post-fire lidar data pre-date the onset of the first winter storm following the fires.
Bare earth differencing results from the Palisades Fire
Changes unrelated to the fires
Bear in mind that not all changes in these results are fire-related. Over eight years have gone by between lidar scans, so some of these differences may reflect routine construction, or unrelated geomorphic processes.
Construction in Santa Monica
How These Data Help
Lidar-based differencing isn’t only about studying wildfire caused destruction; it also helps officials understand risks going forward. City planners and geologists can use these maps to identify which slopes along hills and mountains might be unstable or which streams and rivers are at risk of flooding or debris flows after the fire removes vegetation. This information supports rebuilding efforts and can help make communities safer in the months and years following a major wildfire. Topographic differencing approaches similar to those shown here can also be used to understand other natural hazards such as landslides, earthquakes, and flooding.
If you’re curious about other ways scientists use lidar in fire response and recovery, check out how emergency response teams in New Zealand are using lidar to help allocate resources more efficiently, or how researchers are using deep learning to identify wildfire damage.
In Closing
Topographic differencing is a powerful tool for visualizing and quantifying how wildfires can reshape our environment—from altering the landscape and removing vegetation to damaging infrastructure. These data empower communities and scientists to make informed decisions about rebuilding, mitigation, and future preparedness.
View and explore the differencing results on an interactive map.
To learn more about topographic differencing, see this post with more technical details, video tutorials, and links to open source code. OpenTopography provides on-demand, browser based tools to compute topographic change between overlapping datasets. This tutorial video provides an introduction.
Access the differencing results, the pre-fire data and the post-fire data (Palisades and Eaton) on OpenTopography.
Email us at info@opentopography.org with questions.