On-Demand 3D Topographic Differencing
By Chelsea Scott
OpenTopography is happy to announce the release of our new on-demand 3D differencing tool. With our vertical differencing tool released last year these topographic differencing tools take advantage of the growing set of multi-temporal datasets hosted by OpenTopography and technological advances in measuring surface change from high resolution topography. These tools offer the opportunity to measure ground surface changes over time due to a range of natural and anthropogenic processes from over 45 dataset pairs.
Our 3D differencing capability is the latest offering from OpenTopography in a growing set of processing tools that promote data discovery and analysis for both novice and expert users. Via OpenTopography’s portal interface, users can now calculate 3D surface displacement from two high resolution topography datasets. 3D differencing is best applied to earthquakes (check out the Kumamoto and El Mayor Cucupah examples) and can also measure deformation associated with landslide movement and sand-dune migration. Below, we present several use cases of topographic differencing.
This YouTube video tutorial explains how to perform 3D differencing on OpenTopography:
Earthquake deformation:
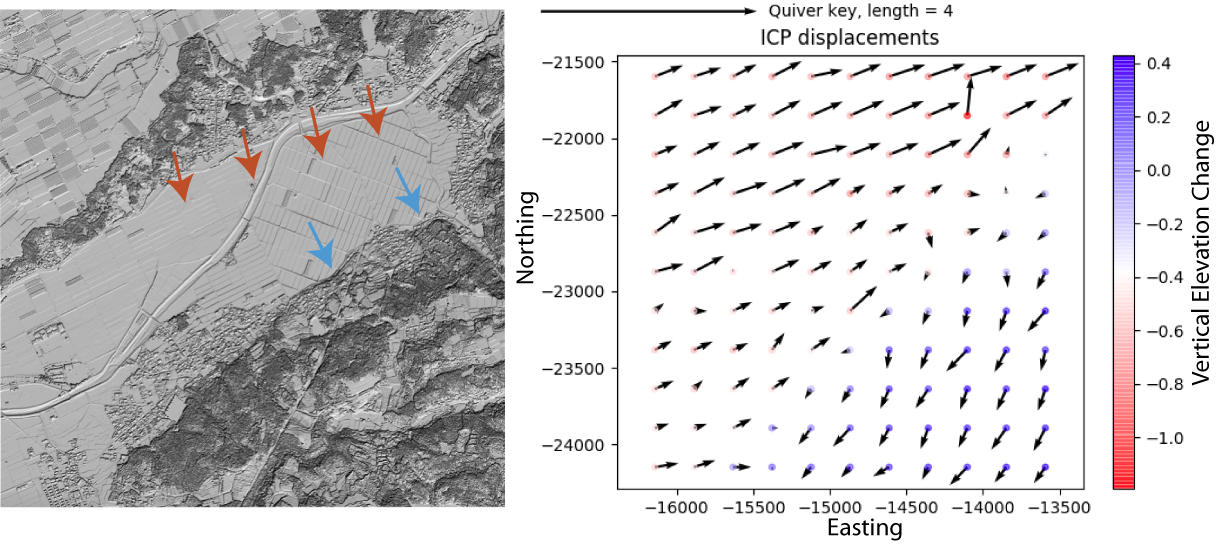
The 2016 M7 Kumamoto, Japan, earthquake ruptured a dominantly right-lateral fault along the Kyushu Island of southwestern Japan. The topographic hillshade (left) shows a faint fault that ruptured through agricultural fields and a second fault to the south along the boundary between the field and the town. The 3D differencing map (right) shows arrows that represent horizontal surface displacement. The colors at the arrow tail represent vertical displacement. The sharp changes in arrow magnitude and direction are the locations of the two faults. In this earthquake, the faults accommodated right-lateral and down to the northwest motion. Displacements increase with distance from the fault, illustrating that there was off-fault deformation during the earthquake. Maps of surface displacement are important for constraining the earthquake magnitude, the distribution of slip along the fault, and ultimately seismic hazard.
 3D differencing during the 2016 M7 Kumamoto, Japan, Earthquake.
Sand-dune migration:
The White Sand Dunes National Monument in southern New Mexico is a dune field made of gypsum sand that covers 275 square miles in the Chihuahuan Desert. Strong winds typically from the southwest push the sand into dunes, which can move several feet during a windy day. The topographic hillshade (left) shows typical dune shapes consistent with dune migration to the northeast. Vertical differencing (middle) shows that individual dunes shrink to the southwest (red) and grow to the northeast (blue), again consistent with migration to the northeast. The 3D differencing map (right) shows motion towards the northeast, although there is some noise present in the measured displacements.
3D differencing shouldn't be applied everywhere:
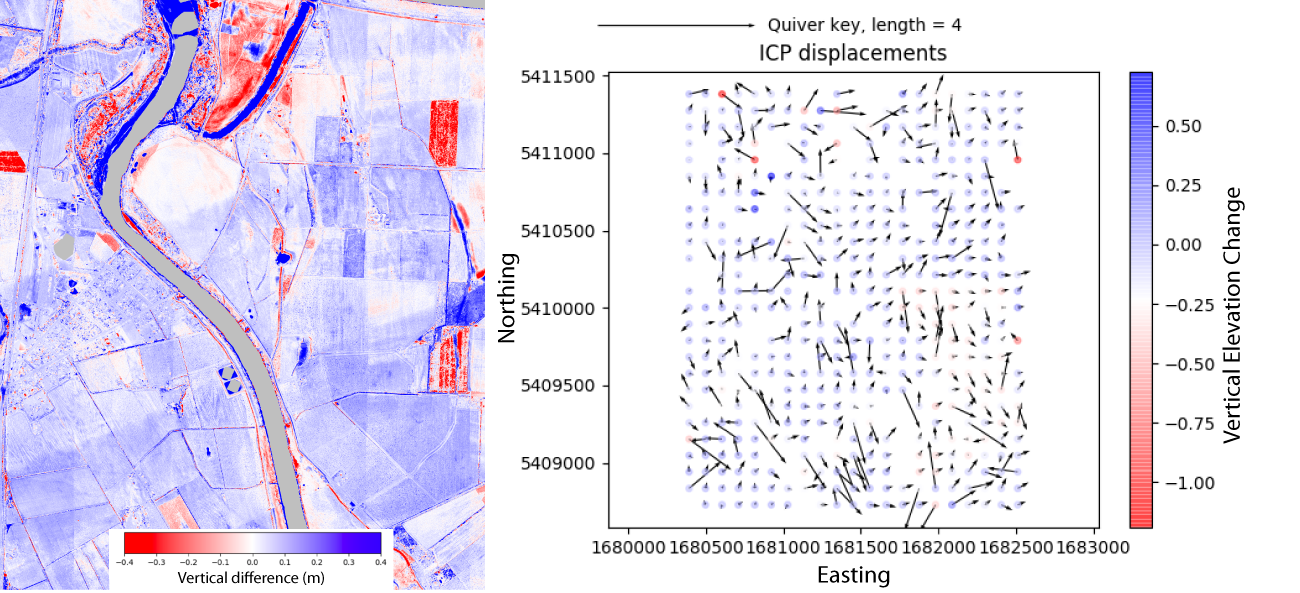
3D topographic differencing measures the lateral translation and rotation (see below) and is not applicable to all cases, such as river processes. Left: Vertical differencing measures deposition and erosion along a river in the South Island of New Zealand, as well as change in crop height in nearby agricultural fields. Right: 3D differencing measures displacements that do not reveal a clear pattern of landscape change. This is an example where vertical differencing is the ideal approach.
 Differencing along a river in Blenheim, South Island of New Zealand from 2014-2018
3D Differencing behind the scenes:
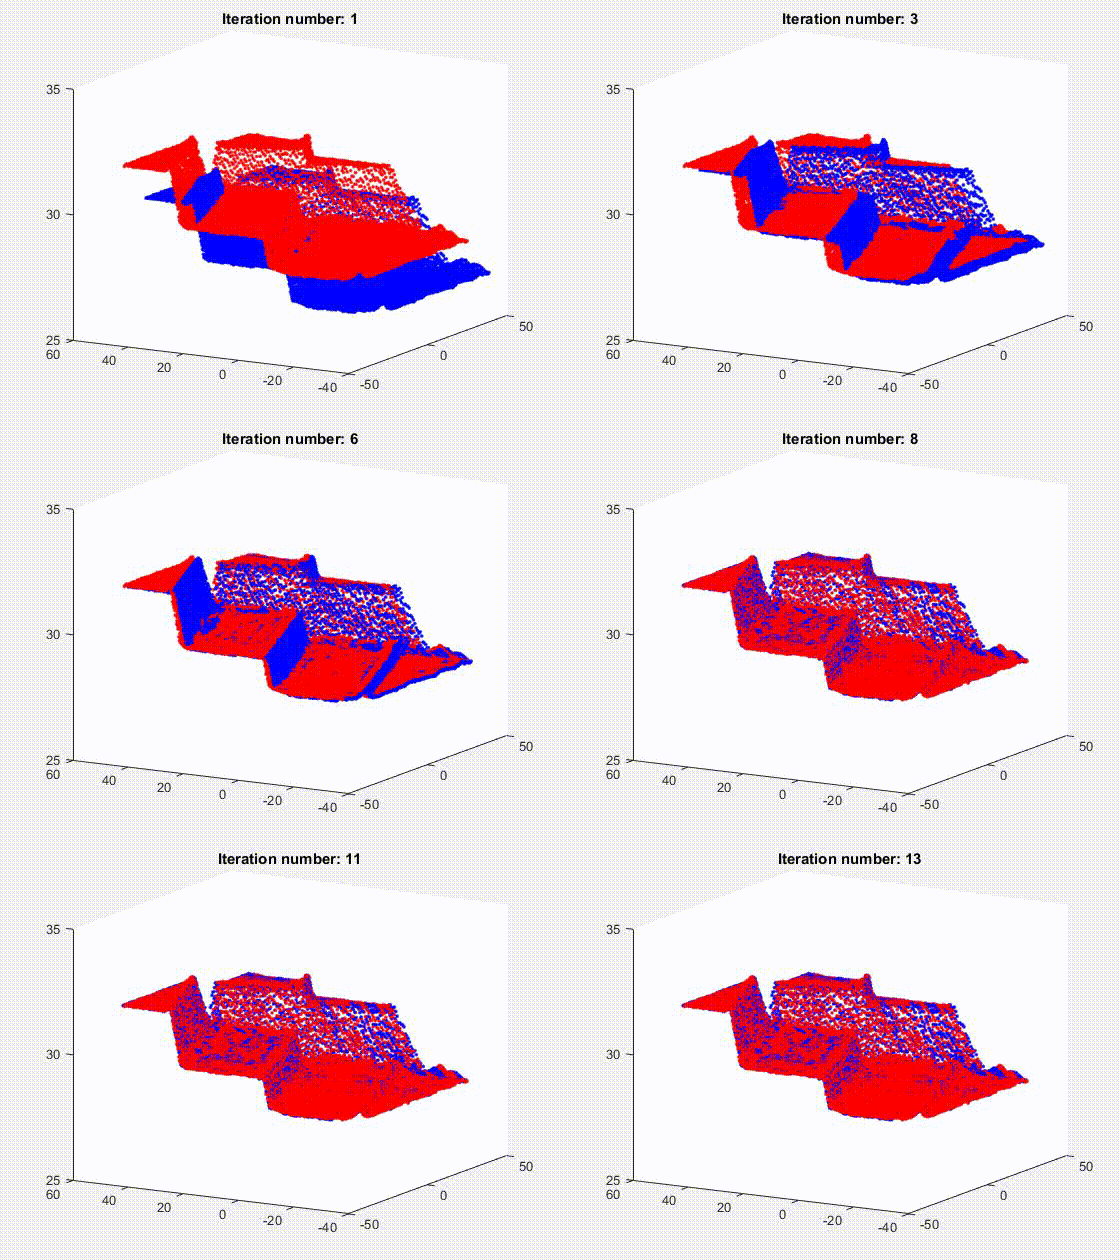
In 3D differencing, deformation at the Earth’s surface is measured as the best rigid transformation (translation and rotation; scale is usually assumed constant) required to register windows of pre- and post- event point cloud topography. The iterative closest point (ICP) algorithm is used to calculate the best alignment. In airborne lidar data, the point clouds typically have a point density of 0.5-30 pts/m2, and the window size or resolution the 3D displacements is typically a few tens of meters.

Iterative Closest Point (ICP) point cloud registration: The blue point cloud is iteratively moved towards the red point cloud. Typically, the two point clouds have a different point density (number of elevation measurements per area) and there is not an exact point-to-point registration between the two clouds. Still, the ICP algorithm is able to align the two surfaces.
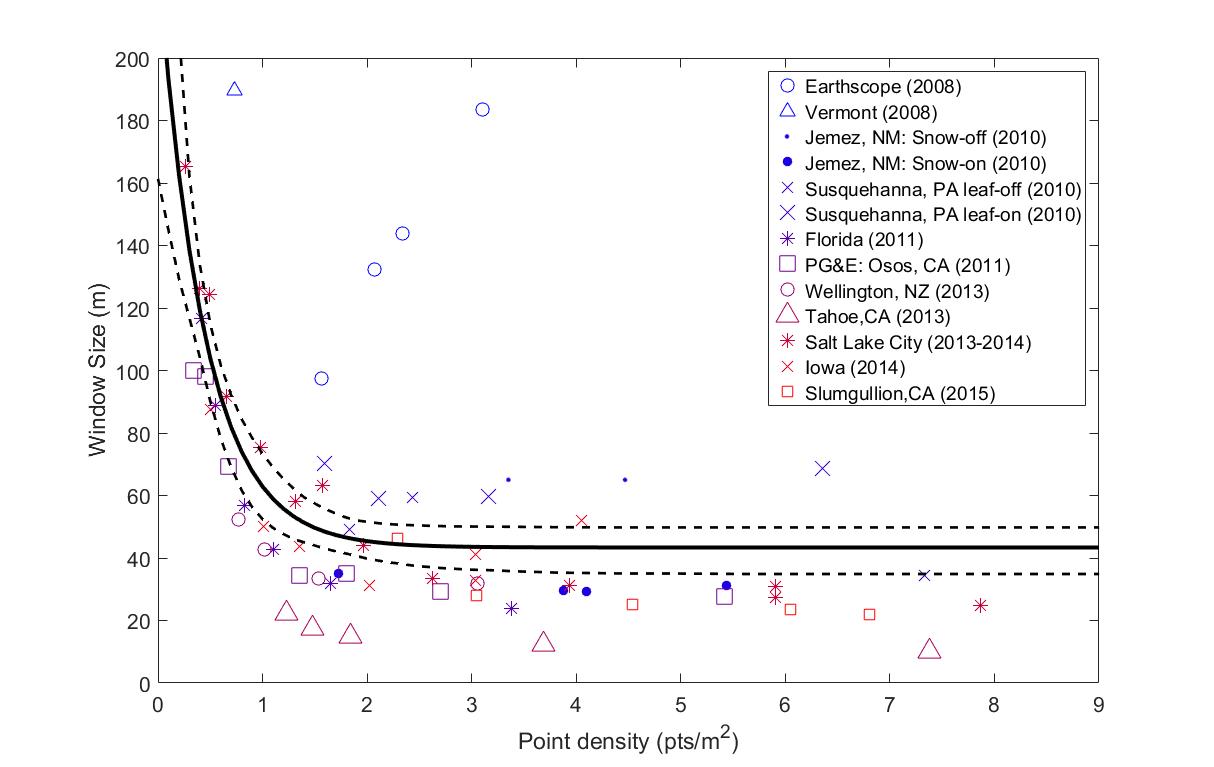
The windowed registration of the 3D differencing requires that the landscape typically maintains its shape as it moves. 3D differencing is therefore most valuable when applied to earthquakes and less applicable to process including erosion, volcanic eruptions, and vegetation changes. Window size or resolution is a trade-off between a small window that is less likely to violate the rigid body assumption and a large window with enough topographic structure to produce an accurate alignment. The ideal window size depends on the point density, data quality, and vegetation structure. Determining the best window size is challenging. In the on-demand differencing hosted by OpenTopography, we recommend a window size based on synthetic testing and the point density of individual datasets. This recommendation is made to help novice and advanced users get quality differencing results on their first analysis of a dataset pair. Further testing may improve results. In particular, the use of only ground classified points often improves results when the ground-classified point density remains above 0.5 pts/m2.

3D differencing window size: The recommended window size is the upper dashed curve. This analysis represents synthetic testing on a range of datasets hosted by OpenTopography.
Reference: Scott, C.P., Phan, M., Crosby, C., Nandigam, V., Arrowsmith, R., On-Demand 3D topographic differencing hosted by OpenTopography: American Geophysical Union Fall Meeting, 2019, T51B-06.

