The Utility of Lidar: Mapping Risk, Planning Smarter, and Protecting
Apr 24, 2025
By Hayley Bricker
Utility companies, responsible for providing power, water, and telecommunications services, rely on precise, high-resolution 3D elevation data of the Earth’s surface to plan projects, maintain infrastructure, and mitigate natural hazards. Light ranging and detection, or lidar, provides a powerful solution, producing a high resolution, three-dimensional map of the Earth’s natural and built environments. From 3D point clouds, lidar scans can be used to generate digital terrain models (DTMs), which represent the bare surface of the Earth, and digital surface models (DSMs), which include vegetation and built structures. These detailed elevation models are essential tools that can be used in the utility industry for a variety of projects and applications.
Wind Energy
Lidar helps identify ideal locations for wind farms by mapping the topography in detail. By mapping hills, valleys, and other topographic features, lidar data can be combined with meteorological models to predict wind acceleration, deflection, and turbulence. Slope and aspect analyses of the topography, which indicate the steepness and compass direction of the terrain, help infer the behavior of the wind. With these analyses, wind patterns can be rigorously assessed to better inform placement of wind resources like turbines and wind farms.
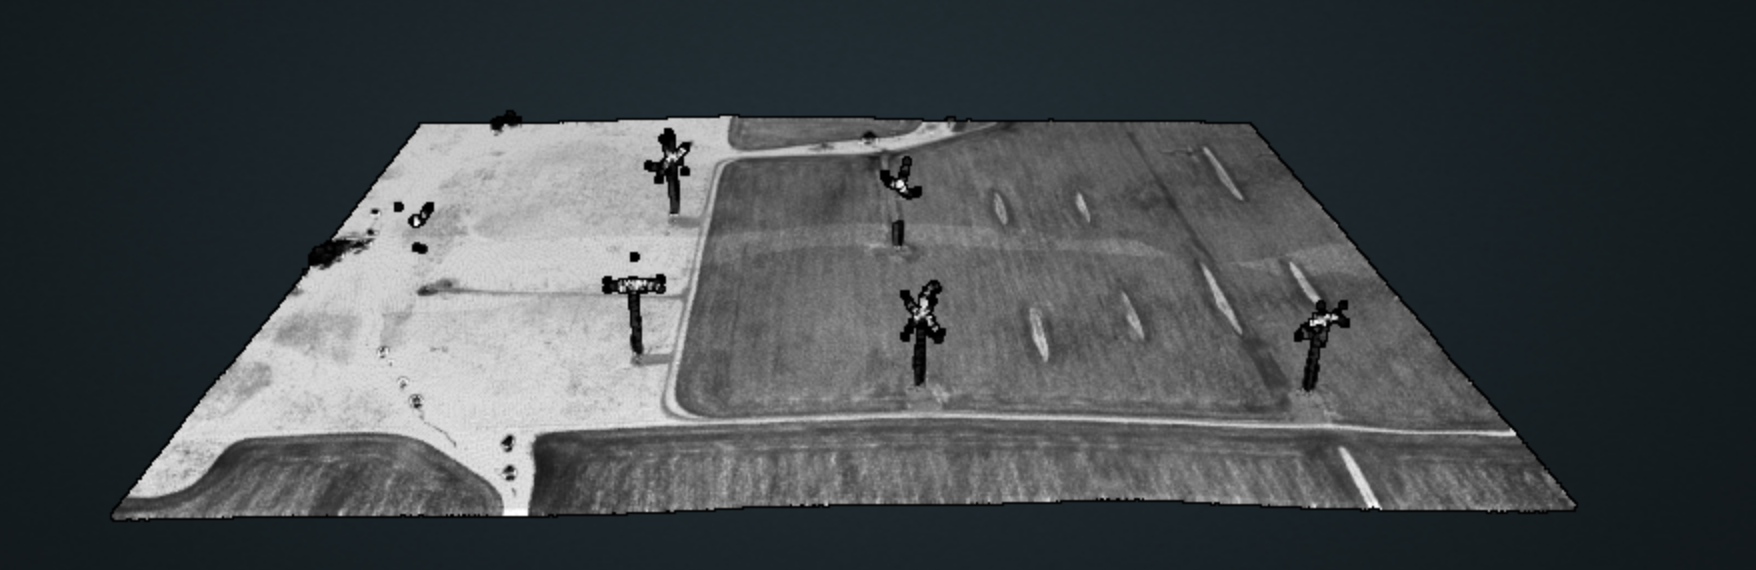
A lidar point cloud of a wind farm in Minnesota colored by intensity.
Solar Power
Building a solar farm or installing solar panels in urban and rural areas requires a careful consideration of the region’s solar incidence. Lidar data can quantify the amount of solar radiation that reaches a given surface by accounting for both topography, like mountains, and surface objects, like buildings and trees. These data are used to understand how the terrain will impact the sunlight reaching the surface and estimate how much vegetation and built structures will contribute to shading. These high-resolution data products can be used in conjunction with solar shading models, which simulate the amount of shading on the surface over a range of different insolation conditions, to optimize solar panel placement and solar rooftop potential.
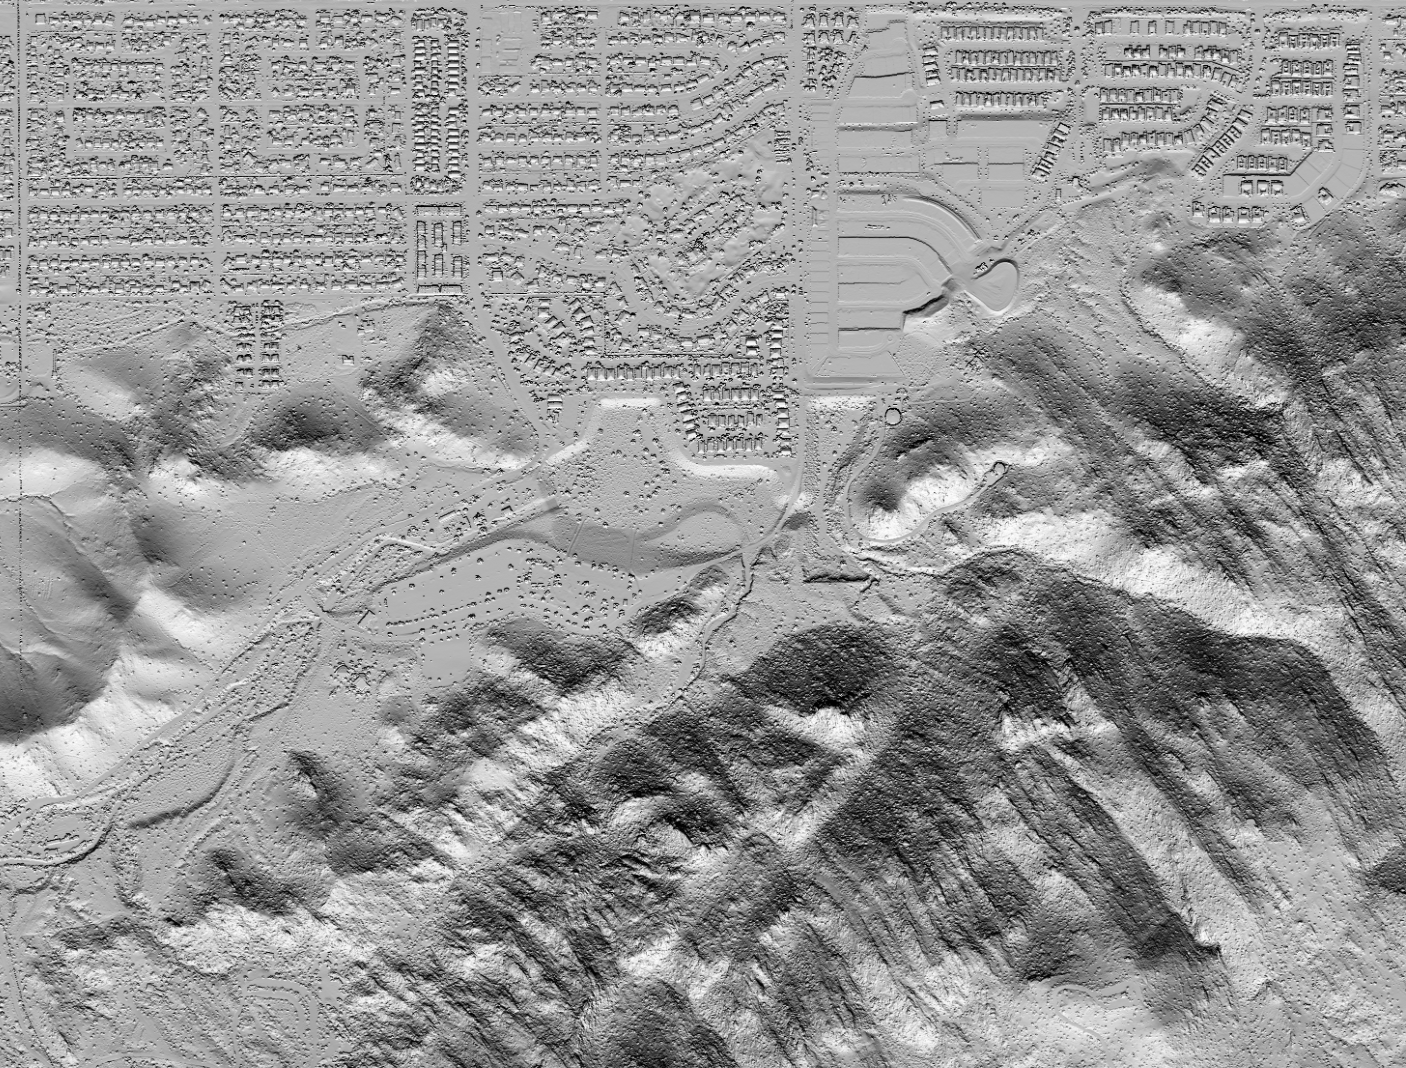
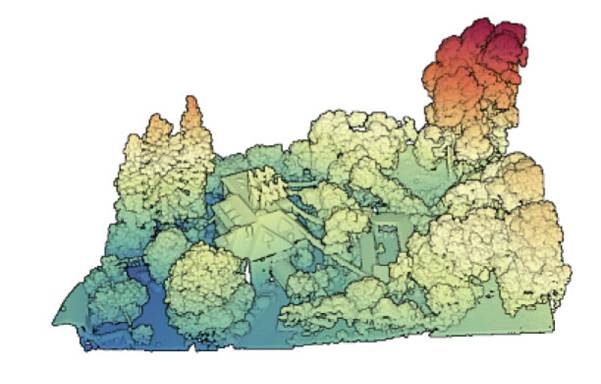
(Top) Digital surface models of the mountainous topography surrounding a suburban development Phoenix, Arizona, in can help to model shading and its impact on solar potential across different times of day and year. (Bottom) Density of shading from vegetation in Berkeley, California, visualized with a 3D lidar point cloud. Placement of solar panels for solar power generation can be informed by these datasets showing where the most sunlight is received.
Stream Mapping, Flooding Risk Assessment, and Sediment Erosion
Understanding how water moves across the landscape is critical for designing infrastructure that can withstand flooding and erosion. Using lidar-derived DTMs, the direction of flowing water across landscapes can be modeled based on the slope of the topography. By identifying the steepest topography, planners can determine flow direction and analyze stream networks to assess drainage capacity. Lidar topography also aids in estimating where flooding might occur when streams overflow or identifying where large drainage areas can lead to erosion due to steep, unstable topography. The information provided from lidar scans helps planners mitigate flooding hazards, improve water management strategies, and protect crucial infrastructure like pipes and power lines.
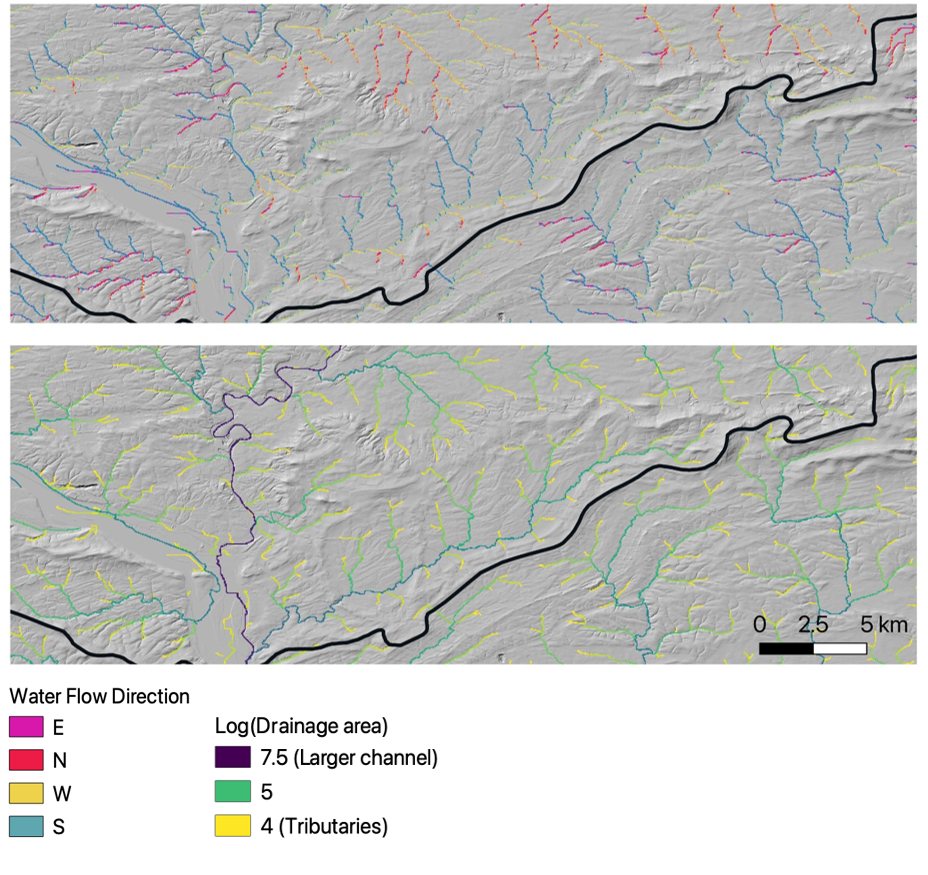
(Top) Stream flow direction shaded by compass direction in Harrisburg, Pennsylvania. (Bottom) Drainage area modeled as the logarithm of drainage size. Stream size correlates with drainage area size, which can help planners understand the regions prone to the largest flooding and erosional risks.
Lidar can also be used to map changes in topography over time to show where erosion and deposition may occur. This can be done with an approach called topographic differencing, which calculates the vertical change of a landscape using multiple lidar scans collected at different times. In this context, areas with negative topographic change indicate erosion, and positive topographic change indicates deposition. This approach is valuable for monitoring riverbank stability, long-term erosional trends, and analyzing isolated before-and-after events like landslides. Lidar data can provide inferences about where to build structures to minimize risks from erosion, and where to make existing adjustments and reroutings to minimize environmental impact.
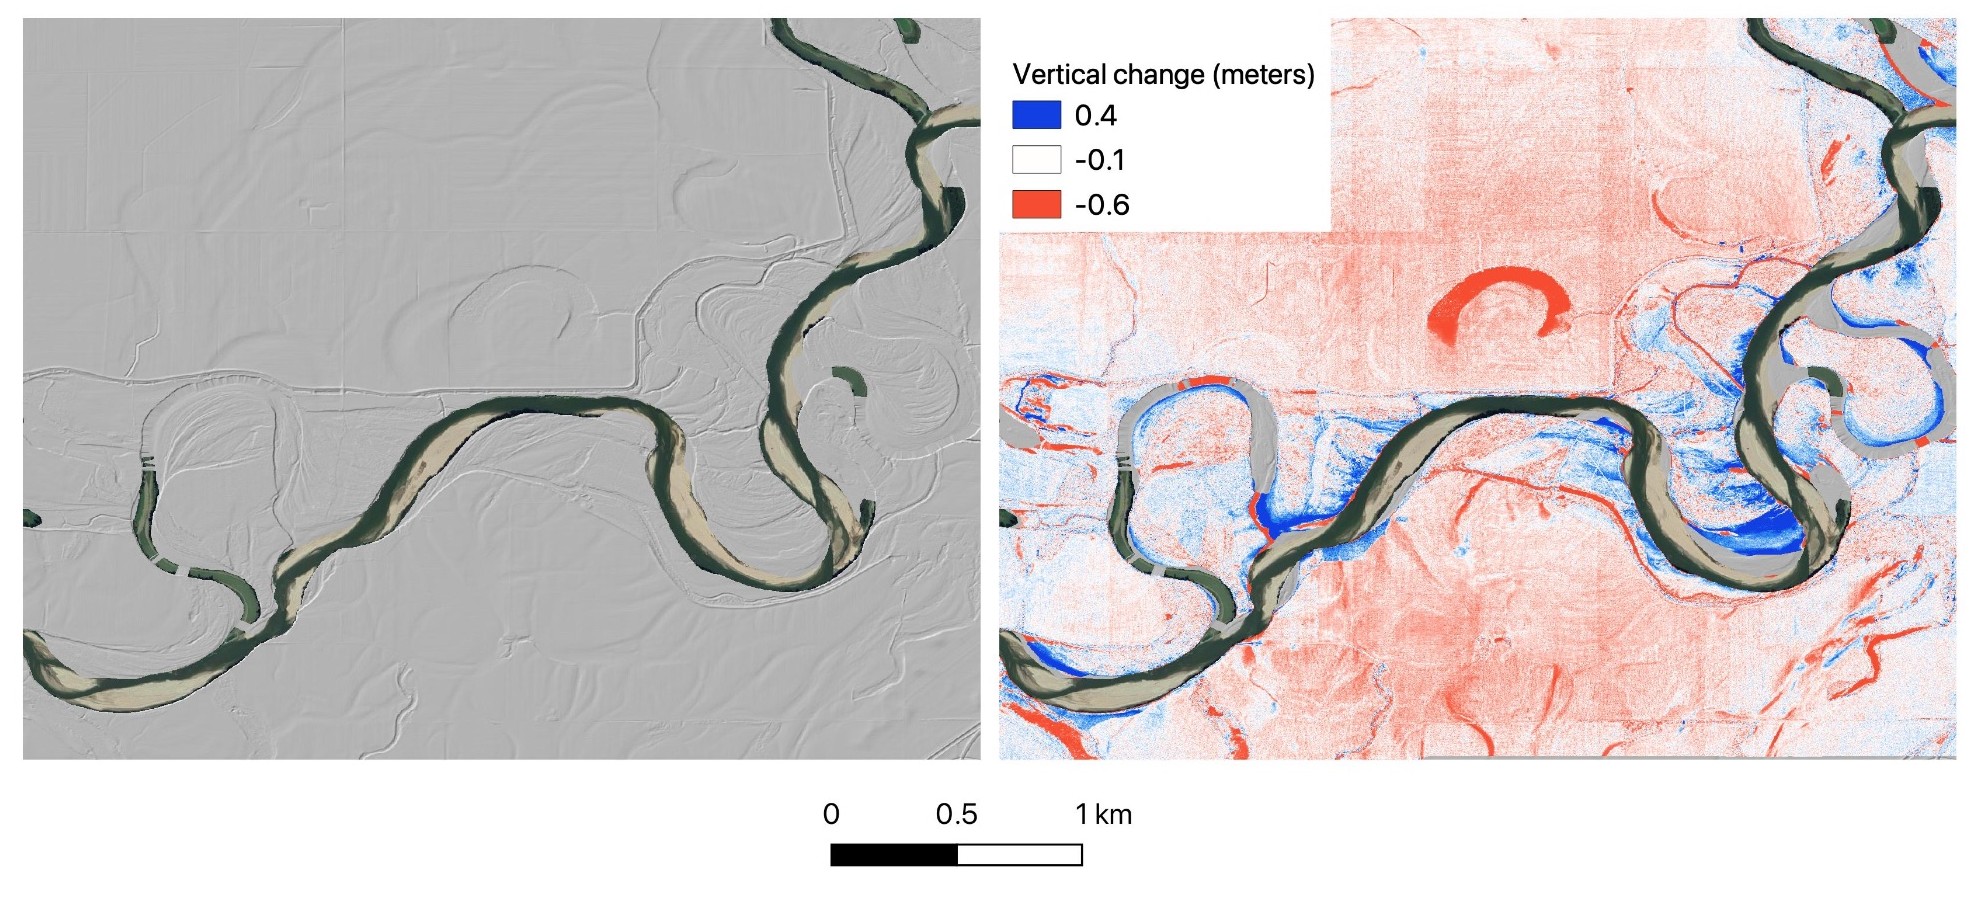
(Left) A DTM hillshade of a meandering river in western Indiana showing where the river has changed course. (Right) Vertical change map demonstrating erosion (red, negative change) and deposition (blue, positive change), highlighting where changes to the river might impact surrounding infrastructure.
Earthquakes and Faults
Earthquakes can destroy crucial infrastructure within seconds, posing risks to both public safety and utility networks. Utilities such as powerlines and pipelines are especially susceptible to ground movement, which may cause catastrophic leaks that harm not only the infrastructure itself but the surrounding population and environment. Lidar scans can be used to reveal subtle fault traces by capturing detailed topography of the Earth’s surface, even in areas with dense vegetation or limited surface expression. Understanding where the ground may rupture in an earthquake with lidar scans can help planners determine where and how to build resilient infrastructure for oil, water, and electrical lines that will be least impacted by earthquakes.
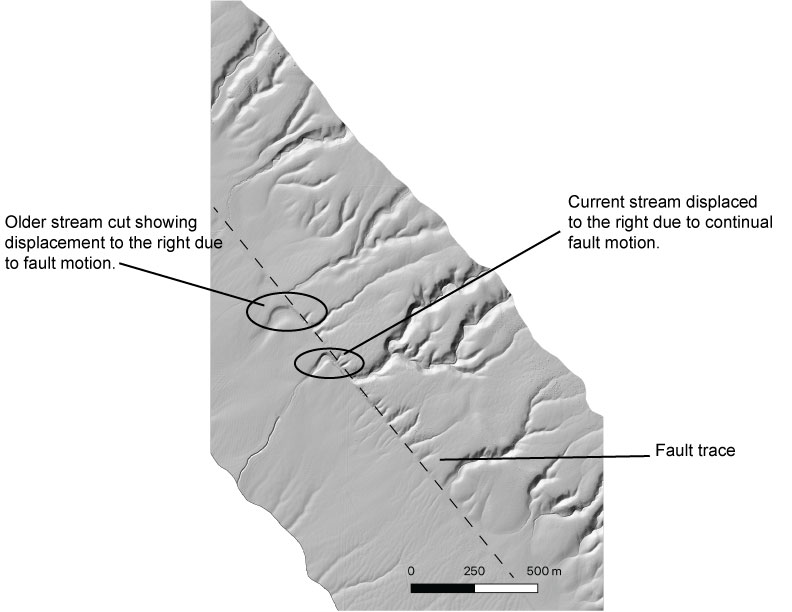
A DTM hillshade of the Wallace Creek section of the San Andrea Fault in California. Historical stream displacement from fault movement can be seen in the lidar scan. Assessing the topography with lidar scans can help utilities decide where to place infrastructure to avoid loss in the future.
Wildfires
In the wake of wildfires, such as the January 2025 fires in Los Angeles County, lidar is a critical tool for assessing structural and vegetation loss. By comparing changes in elevation from before and after scans of affected regions, reductions in topography reflect the extent of destruction of buildings and vegetation from the fires. This method is especially useful when traditional methods of assessing structural damage and burn areas, such as on-foot surveys or aerial imaging, are hampered by threats to physical safety or smoke. Additionally, lidar data provides an important toolset to prevent and mitigate fire risk. Data can identify high-risk areas subject to vegetation encroachment on utility infrastructure that can cause damage that hinders operations, such as fallen tree limbs causing power outages for electrical powerlines. Implementing lidar data into vegetation management workflows can help utilities avoid costly accidents.
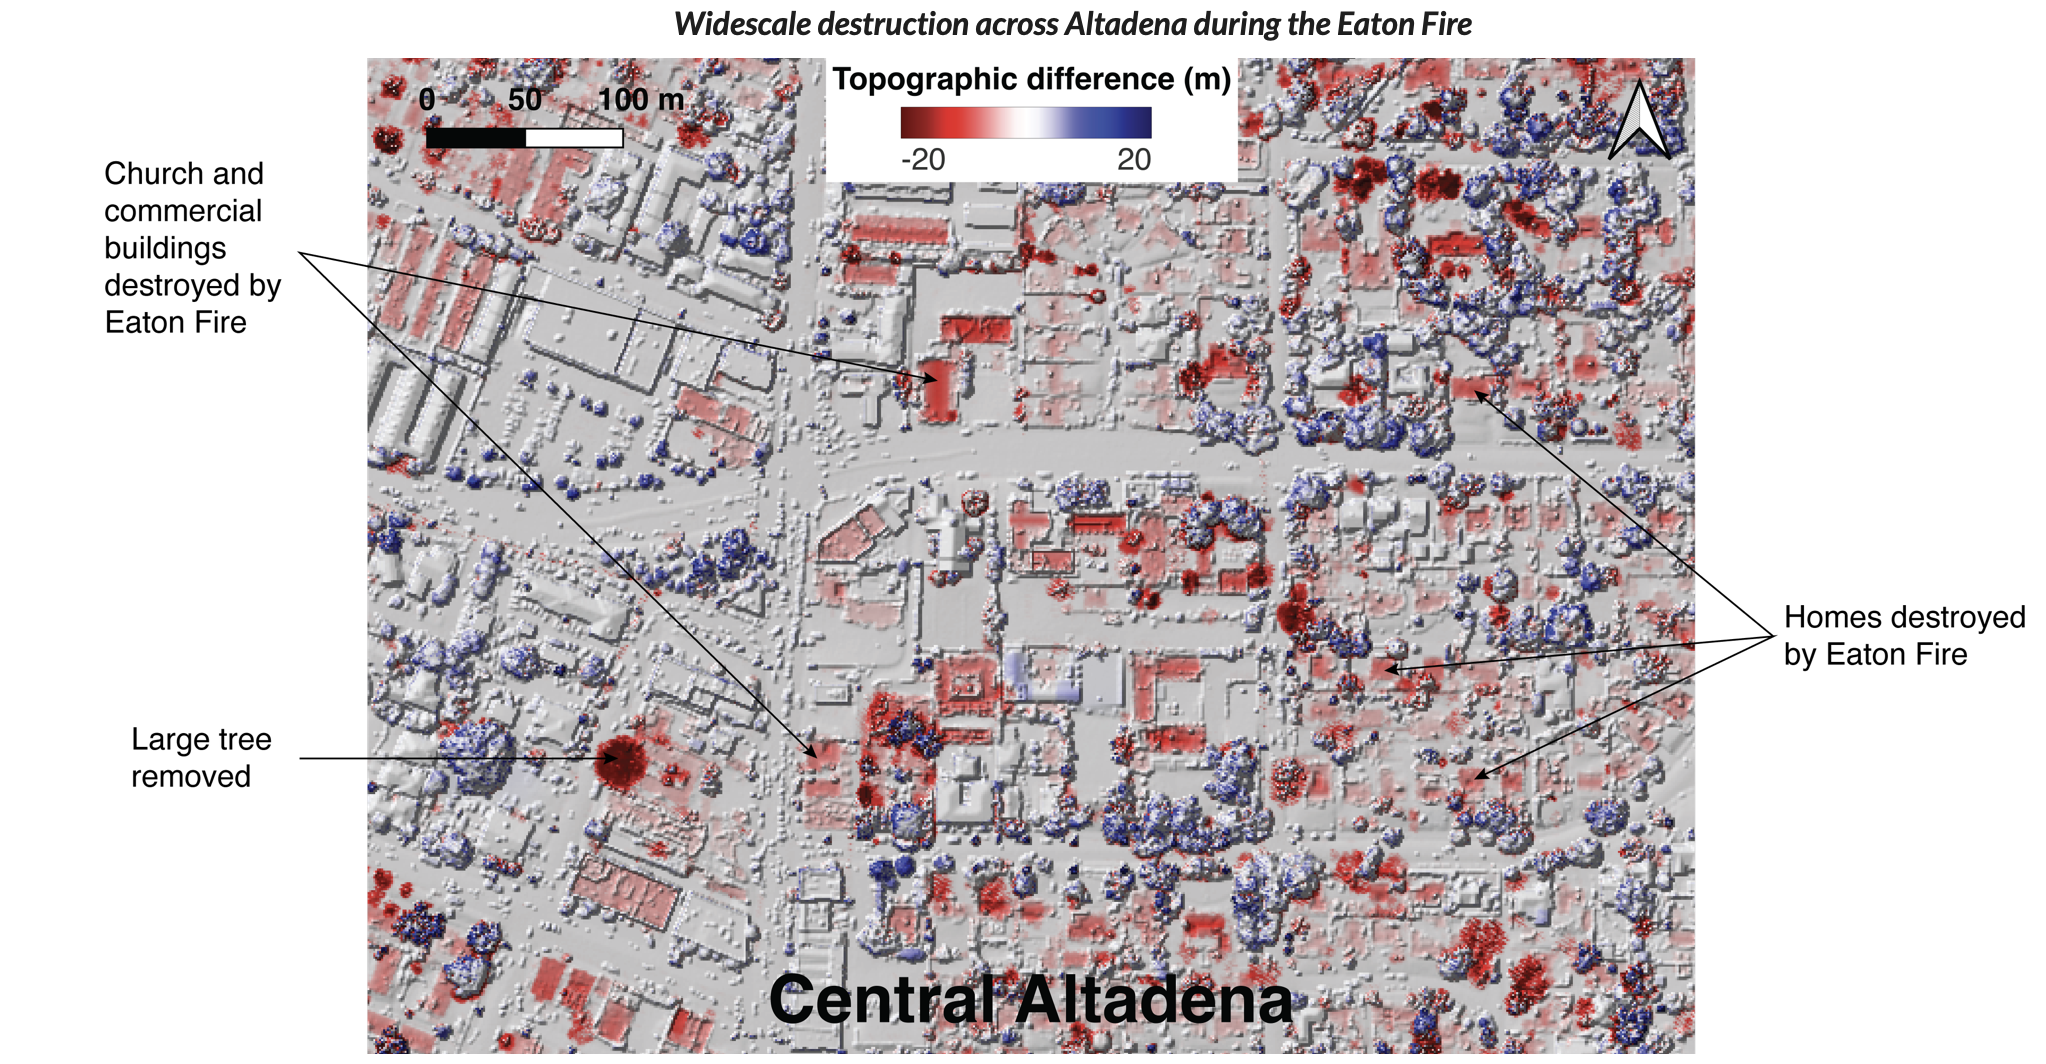
Topographic differencing map of Central Altadena, Los Angeles County, after the January 2025 fires. A reduction in the topography (red) indicates a loss of structures and vegetation. This can help utilities assess where damage to infrastructure has occurred, or where to fortify surviving structures.
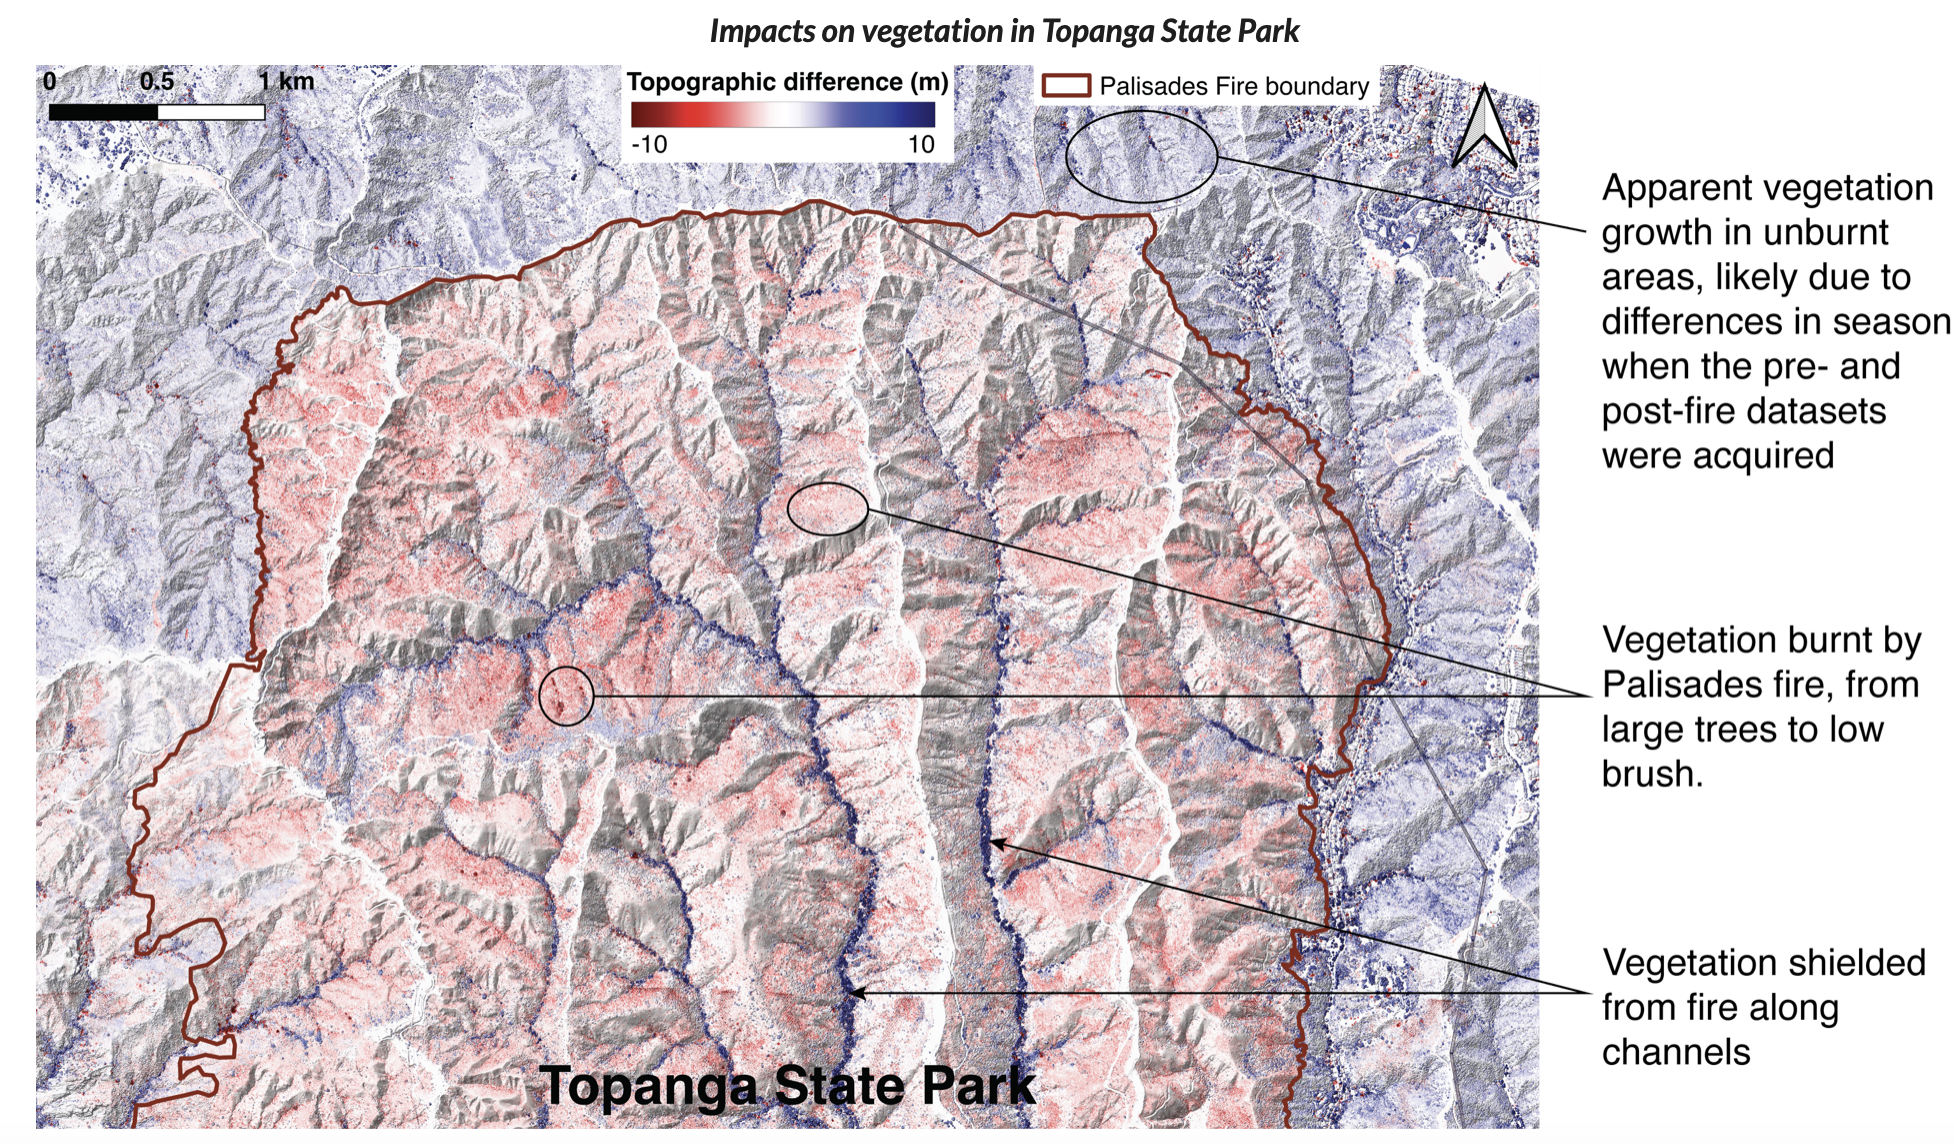
Topographic differencing map of Topanga State Park in Los Angeles, California, highlighting the extent of the Palisades burn area (red), with unburnt vegetation shown in blue.
Lidar data can help engineers, environmental managers, and urban planners to make informed decisions on where to build utility infrastructure, identify potential hazards, and monitor changes for a safer future.