Highlight: October 2022-January 2023 publications using OpenTopography datasets
by Emily Zawacki and Chelsea Scott
OpenTopography periodically highlights new research results that demonstrate the use and reuse of data from OpenTopography. These four publications highlight topographic research applications in seismology/earthquakes, geomorphology, and wildlife management.
Calculating fault slip rates on New Zealand’s South Island
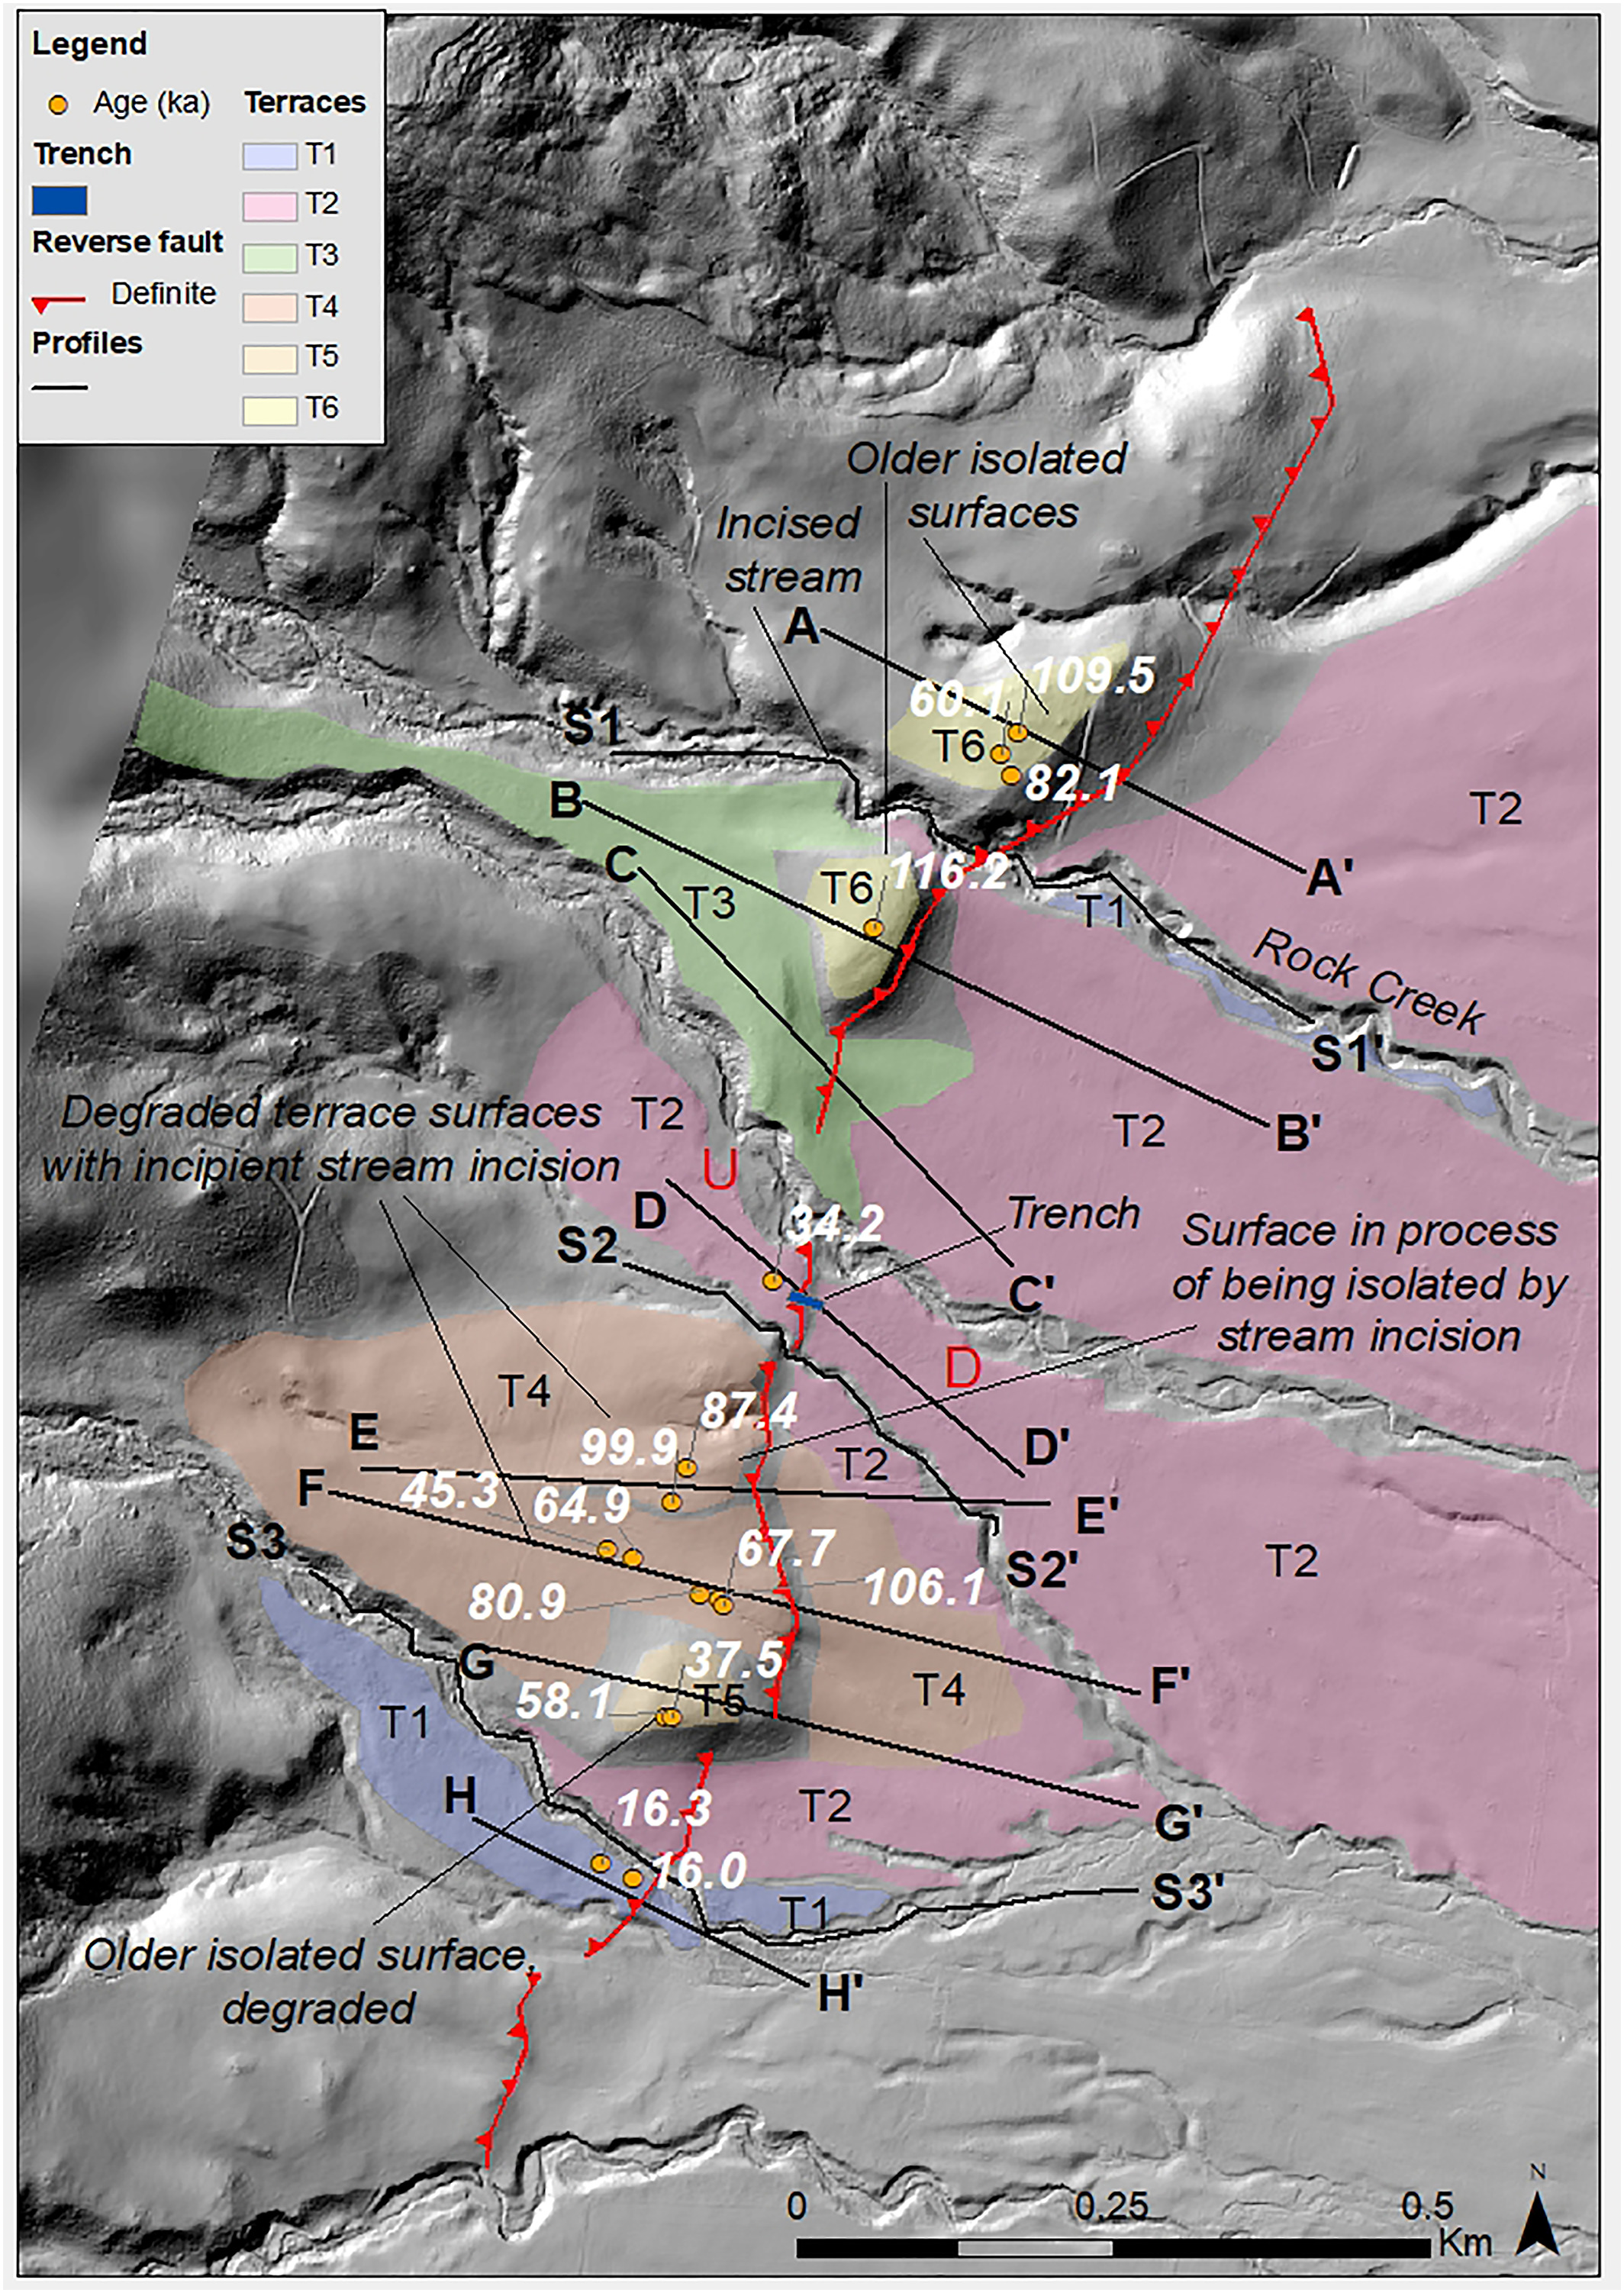
New Zealand lies at the boundary between the converging Australian and Pacific tectonic plates, resulting in a long earthquake record on both the north and south islands. Griffin et al. evaluated the slip rate of two faults in Otago, southern New Zealand to determine the variability of how often earthquakes occur along these faults. The authors used a digital elevation model (DEM) from lidar data and derived products including hillshades, slope maps, and contours to map the fault trace and faulted alluvial fans. They dated the faulted alluvial fans and used topographic profiles to measure the vertical displacement caused by faulting. They calculated the average vertical displacement rates and slip rates for two faults over the last 100,000-300,000 years and compared the displacement rates to the paleoearthquake record over the last 50,000 years. The shorter term (~10,000 year) slip rates were three to five times higher than the average long-term rates. Their findings support the hypothesis that strain is shared between neighboring faults on a timescales of tens of thousands of years, causing variations in the frequency of earthquakes on individual faults on shorter timescales.
- Data used: Otago, New Zealand 2016
- Publication: Griffin, J. D., Stirling, M. W., Wilcken, K. M., & Barrell, D. J. (2022). Late Quaternary slip rates for the Hyde and Dunstan faults, southern New Zealand: Implications for strain migration in a slowly deforming continental plate margin. Tectonics, 41(9), e2022TC007250. https://doi.org/10.1029/2022TC007250.

Lidar hillshade of a section of the Hyde Fault in New Zealand, with mapped fan terrace surfaces and fault trace. Figure from Griffin et al. (2022).
Resistant rocks and limited erosion anchor waterfalls in place
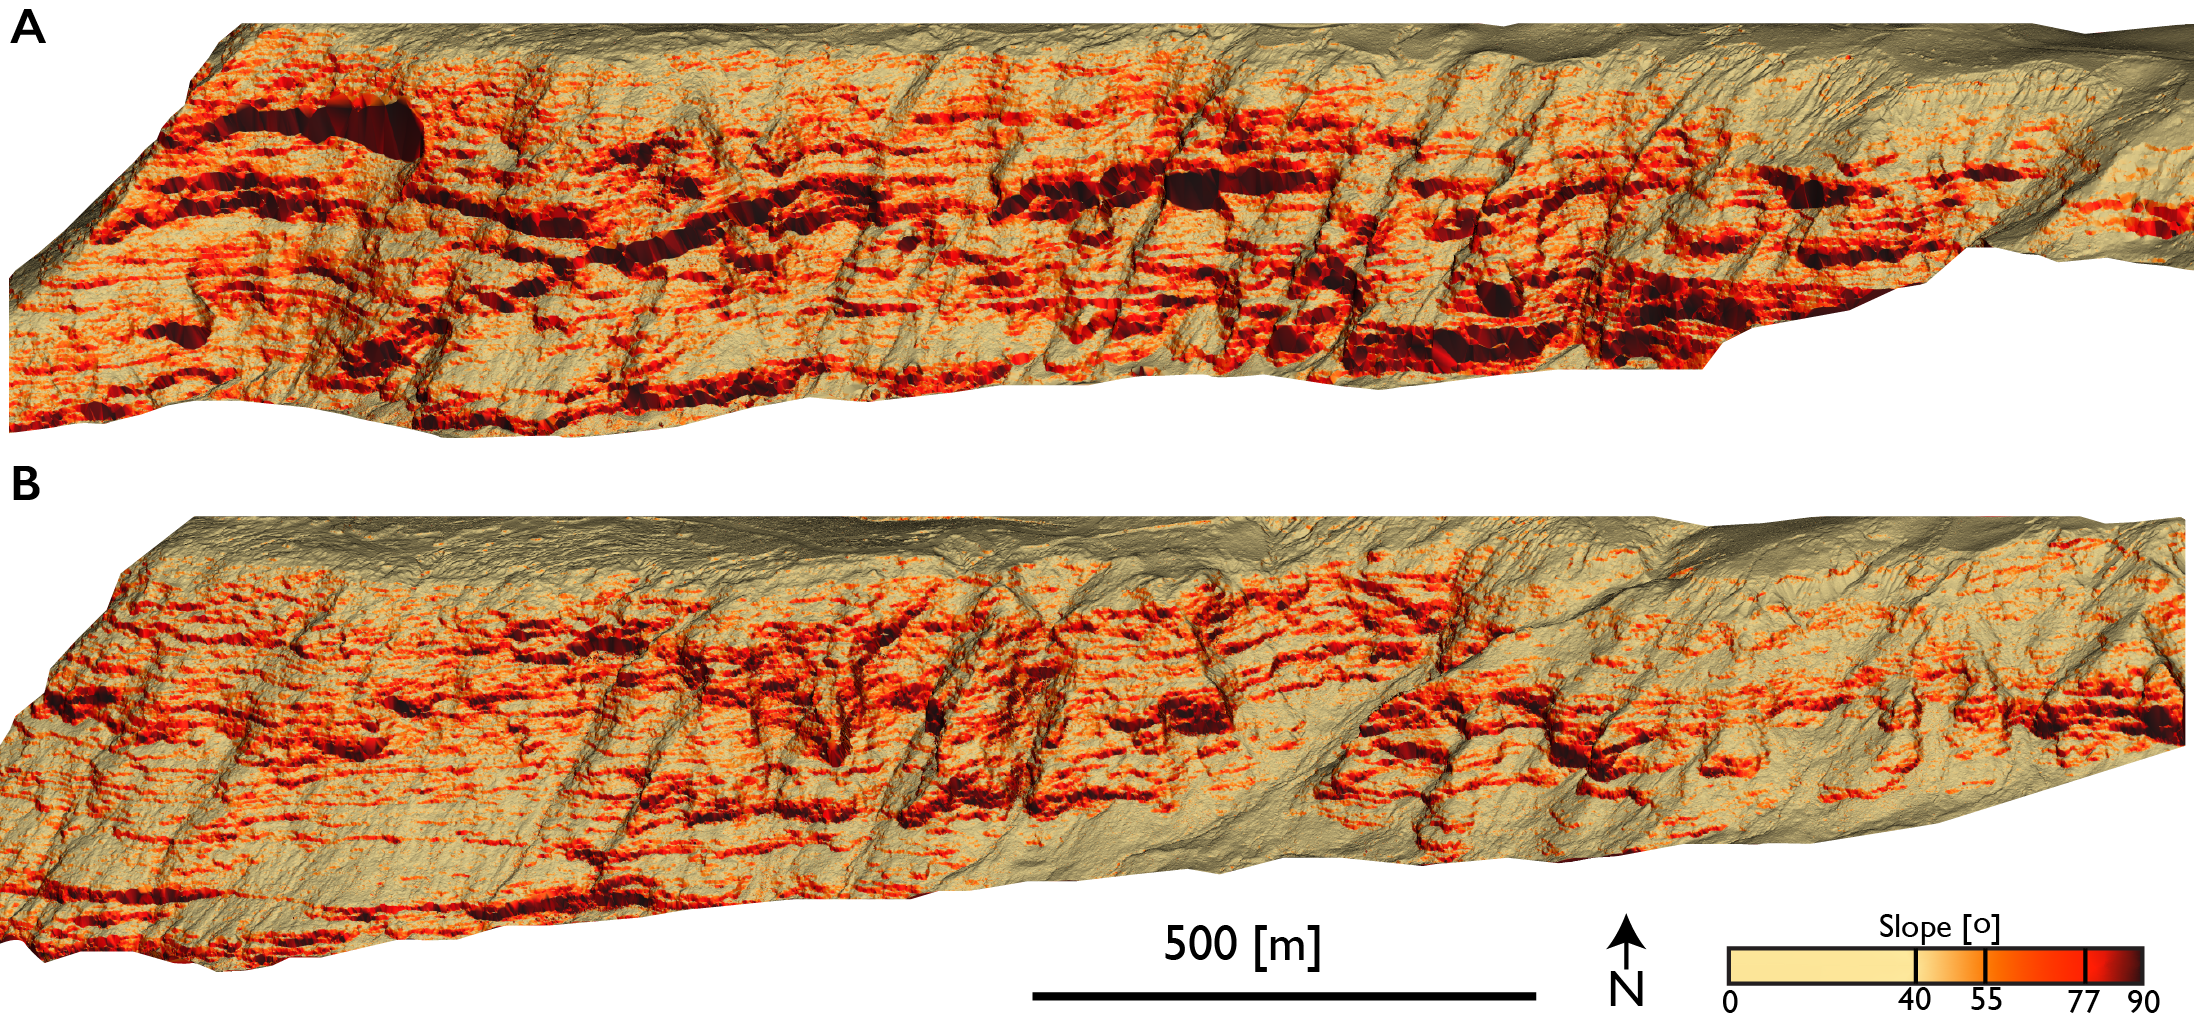
Waterfalls—known as knickpoints in geomorphology—are vertical steps along a river’s topographic profile. Knickpoints typically retreat and move upstream over time, but some may stall in place. The controls on knickpoint stability were explored by Raming and Whipple who studied knickzones—a waterfall or a series of waterfalls—on the island of Kaua’i, Hawai’i to evaluate why many of the knickzones have been long stationary features. The authors used a digital elevation model (DEM) from lidar data to automatically detect knickpoints based on the topography, and they measured the drainage area above each knickzone. 70% of the identified knickzones remained stationary and have not retreated from where they formed and had small upstream drainage areas. The remaining 30% of the knickzones either formed or retreated upstream and typically had larger drainage areas than the stationary knickzones. Based on field investigations, the authors found that strong, resistant lava flows and dikes crop out at the lip of the waterfalls. These resistant rocks appear to stop the migration of knickzones, as below a certain drainage area, there isn’t enough erosive power to incise into the strongly resistant rocks. Thus, knickzones on Kaua’i have become long standing features due to the local geology and erosive thresholds.
- Data used: Nā Pali Coast, Kaua’i, Hawai’i
- Publications: Raming, L. W., & Whipple, K. X. (2022). When knickzones limit upstream transmission of base-level fall: An example from Kaua‘i, Hawai‘i. Geology, 50(12), 1382-1386. https://doi.org/10.1130/G50019.1

Lidar slope shade of a Kaua’i canyon with an upstream knickzone (top) and a canyon without an upstream knickzone (bottom). Image credit: Dr. Wren Raming.
Evaluating water resources for desert bighorn sheep
Understanding the water needs of desert bighorn sheep is an important consideration in management strategies. While desert bighorn sheep can fulfill some water requirements from foraging, wildlife agencies have supplemented desert bighorn with artificial water sources for decades. Glass et al. evaluated the surface water use and movement patterns of desert bighorn sheep in the Mojave Desert, California to understand how environmental conditions can impact their water consumption. The authors evaluated when the bighorn sheep visited surface water sources by deploying wildlife cameras and tracking the sheep's movement using GPS collars. They used Shuttle Radar Topography Mission (SRTM) global data to calculate an individual desert bighorn’s traveling distance to a water source from their given geolocation, taking the topography into account. Their results revealed that the maximum daily temperature was the strongest environmental control of how many desert bighorn sheep visited the water sources daily. Based on the distances traveled with elevation change, desert bighorn sheep made directed movements to water especially in hot and dry conditions. Thus, managing water resources for desert bighorn sheep will be even more important as desert environments continue to warm due to a changing climate.
- Publication: Glass, D. M., P. R. Prentice, A. D. Evans, and O. J. Schmitz (2022). Local differences in maximum temperature determine water use among desert bighorn sheep populations. Journal of Wildlife Management, 86:e22313. https://doi.org/10.1002/jwmg.22313
 |
 |
(Left) Colored hillshade of a digital terrain model of the Mojave Desert, CA study area from SRTM data draped over imagery accessed from Google Earth. (Right) Desert bighorn sheep. Photo by Andrew Barna.
Continued seismic hazards from partial fault-rupturing earthquakes
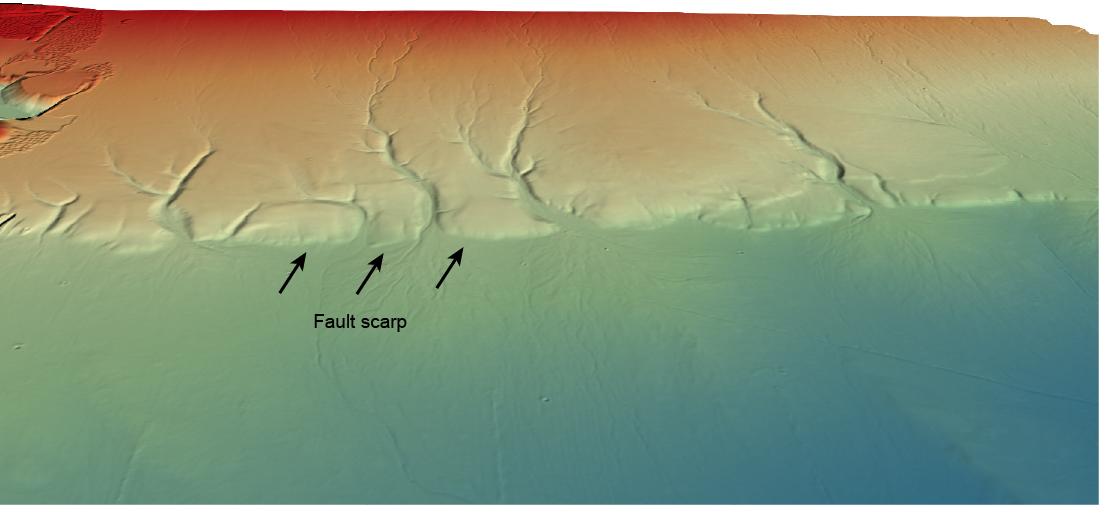
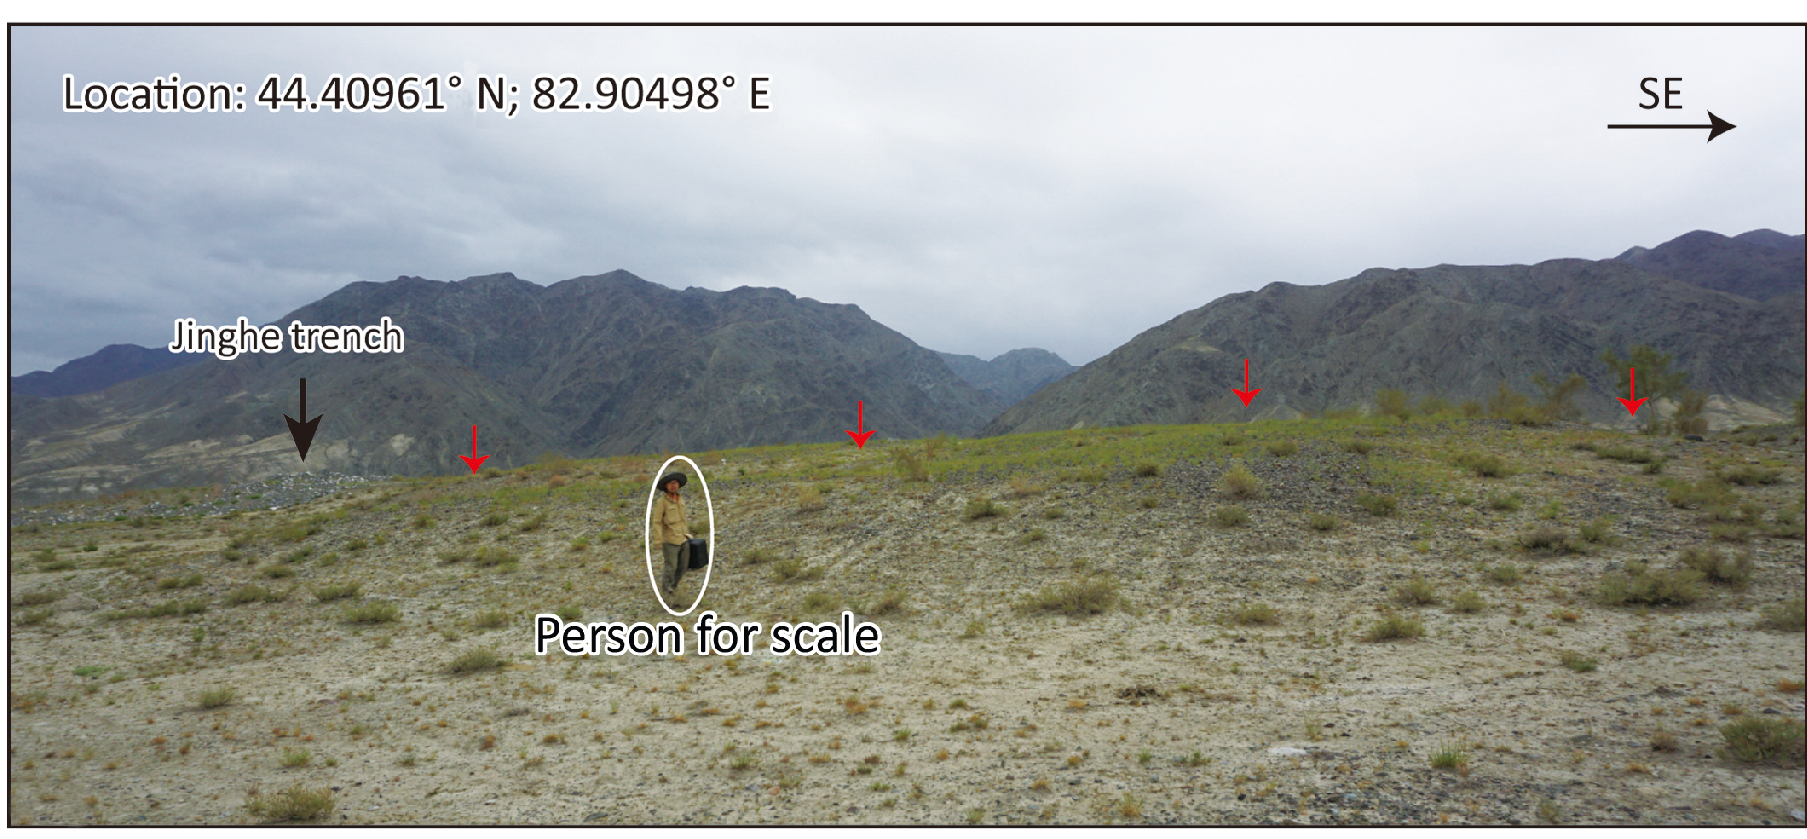
Sometimes, only a small part of a fault ruptures during an earthquake. This partial rupture increases local seismic hazards as other portions of the fault are at an increased risk of rupturing. Partial ruptures are more challenging to measure from the geologic record. Hu et al. evaluated the paleoearthquake history of the Jinghenan fault in northwest China, which produced a magnitude 6.3 earthquake in 2017 that only ruptured along the deeper portion of the fault and did not rupture the surface. The authors performed an uncrewed aerial vehicle (UAV) survey over the fault and created high resolution digital elevation models (DEMs) using structure from motion photogrammetry. Using the high resolution DEM, they mapped the fault trace and measured displacements from topographic profiles across the fault scarp. To evaluate prior earthquake occurrences, they dug a trench across the fault and collected sediment samples to date past earthquakes. They found evidence for four prior earthquakes that ruptured the surface with an average recurrence interval of 7,000 years. The magnitude 6.3 earthquake in 2017 did not rupture the surface, and the 7,000 year interval since the last surface-rupturing earthquake has since elapsed. Thus, the Jinghenan fault likely still poses a high seismic hazard with the potential for future large surface rupturing earthquakes.
The data used in this study were submitted to the OpenTopography Community Dataspace for publication.
- Publication: Li, T., & Pasternack, G. B. (2022). Hu, Z., Yang, X., Li, A., Yang, H., Yuan, H., & Zuo, Y. (2023). Multiple M w≥ 6.5 Strong‐Major Paleoearthquakes Occurred Before the 2017 M w 6.3 Jinghe Earthquake: Evidence from Trenching the Jinghenan Fault. Seismological Research Letters, 94(1), 87-99. https://doi.org/10.1785/0220220084


Left: Colored hillshade of a UAV-derived digital terrain model of the Jinghenan fault showing fault scarps running through the center. Right: Photograph of the eastern Jinghenan fault scarps. The red arrows mark the top of the scarp. Figure from Hu et al. (2022).
OpenTopography is supported by the U.S. National Science Foundation and facilitates access to topographic data for Earth and other scientific research and education. We closely track peer-reviewed publications that use OpenTopography data and services as they are an important measure of our impact.
Have a new paper out that uses data or services provided by OpenTopography and want us to highlight it in a future blog post? Drop us a note: info@opentopography.org
