Highlight: June-September 2022 publications using OpenTopography hosted datasets
Emily Zawacki
OpenTopography periodically highlights new research that demonstrates the use and reuse of data hosted on or accessed from OpenTopography. All of the results we highlight in this blog post are from Open Access publications.
The impact of river flow on tide dynamics
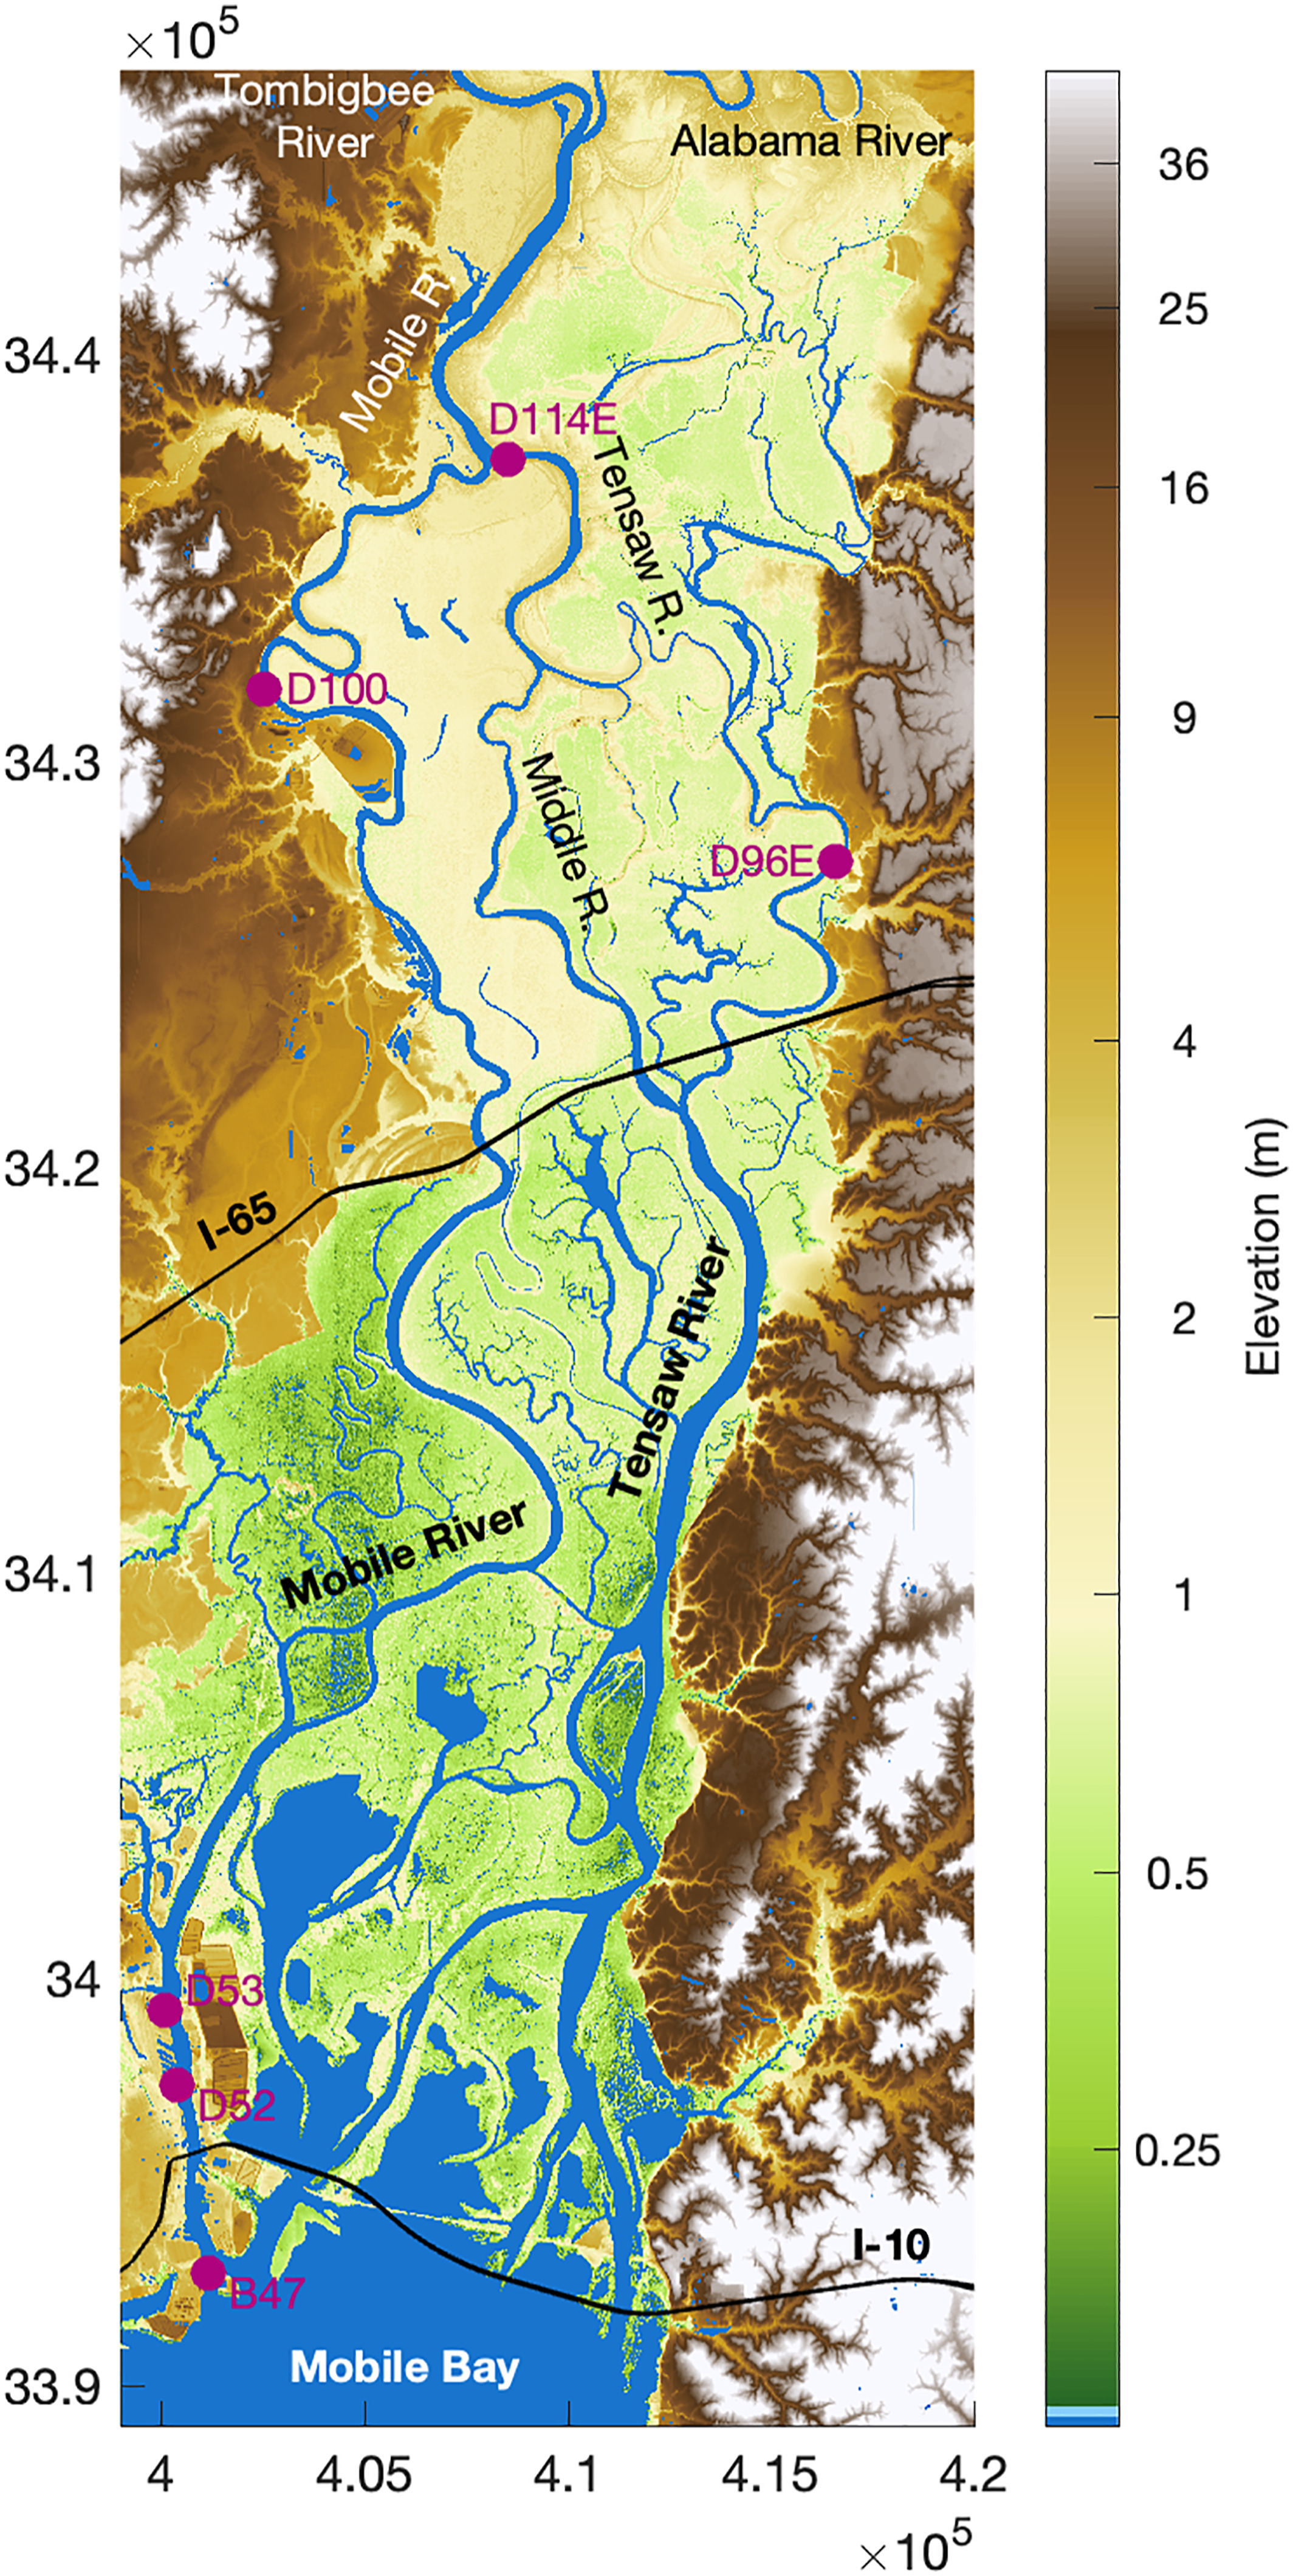
Many large cities are built in coastal regions, which are impacted by tides and rivers. The tide-river interactions can affect flooding, erosion, and water quality of nearby cities, impacting significant populations. Dykstra et al. evaluated how river flow (discharge) impacts tide-river interactions along the Tombigbee River through Mobile Bay to the Gulf of Mexico. The authors used US Geological Survey 3D Elevation Program (3DEP) lidar, global topography, and bathymetry to determine elevations of the riverine and coastal areas. The results indicate that the shape and size of the river channel and the river discharge affect tides. As the river discharge increased, it caused a ~180 km long region to change from an estuary to river environment, shifting the flood and tidal limits. They conclude that the greatest flooding and erosion risks to coastal communities can change between the sea and rivers as tidal limits shift.
- Data used:
- USGS LPC AL 25Co B8 2017
- USGS LPC AL MobileCo 2014 LAS 2016
- Global Bathymetry and Topography at 15 Arc Sec: SRTM15+ V2.1
- Publication: Dykstra, S. L., Dzwonkowski, B., & Torres, R. (2022). The role of river discharge and geometric structure on diurnal tidal dynamics, Alabama, USA. Journal of Geophysical Research: Oceans, 127(3), e2021JC018007. https://doi.org/10.1029/2021JC018007.

The middle and lower Tombigbee-Alabama Delta from the Tombigbee-Alabama confluence to Mobile Bay. Axes units are in meters. From Dykstra et al. (2022).
Dynamic topography of active volcanoes from UAS/drones
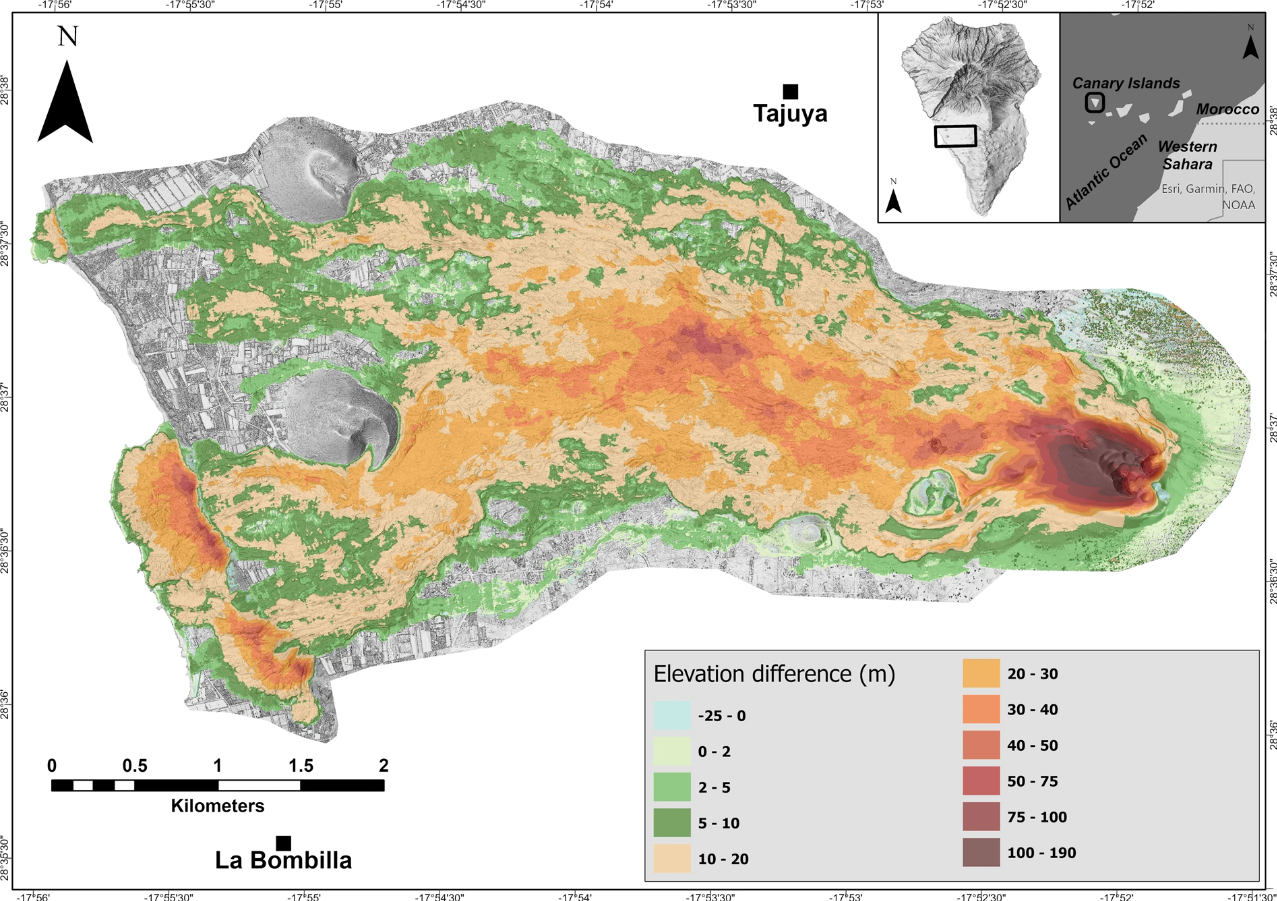
When volcanoes are in active stages of eruption, closely monitoring their topography provides crucial information on the characteristics of the eruption and is helpful for mapping volcanic hazards and modeling volcanic processes. Civico et al. performed an uncrewed aerial system (UAS) (aka drone) survey over the Cumbre Vieja volcano on the island of La Palma, Canary Islands, Spain, after a three month period of eruptive activity. Using Structure-from Motion (SfM) photogrammetry, they produced a high resolution digital surface model. SfM uses hundreds to thousands of overlapping images to create a three-dimensional representation of the surface environment. The authors compared the new topography of the volcano to older topography using topographic differencing, which highlights changes in elevation. The topographic differencing allowed them to quantify changes in the volcano’s height, volume, and aerial extent due to erupted products and eruptive processes.
- Data used:
- 2021 Cumbre Vieja volcano eruption (La Palma, Spain) SfM DSM, Sep 2021
- 2021 Cumbre Vieja volcano eruption (La Palma, Spain) SfM DSM, Jan 2022
- Publications:
- Civico, R., Ricci, T., Scarlato, P., Taddeucci, J., Andronico, D., Del Bello, E., ... & Pérez, N. M. (2022). High-resolution Digital Surface Model of the 2021 eruption deposit of Cumbre Vieja volcano, La Palma, Spain. Scientific Data, 9(1), 1-7. https://doi.org/10.1038/s41597-022-01551-8
- Romero, J. E., Burton, M., Cáceres, F., Taddeucci, J., Civico, R., Ricci, T., ... & Perez, N. M. (2022). The initial phase of the 2021 Cumbre Vieja ridge eruption (Canary Islands): Products and dynamics controlling edifice growth and collapse. Journal of Volcanology and Geothermal Research, 431, 107642. https://doi.org/10.1016/j.jvolgeores.2022.107642

Elevation difference map for the period 2015-January 2022 (pre- and post-2021 eruption). Figure from Civico et al. (2022).
Uncovering the history of ancient earthquakes in California
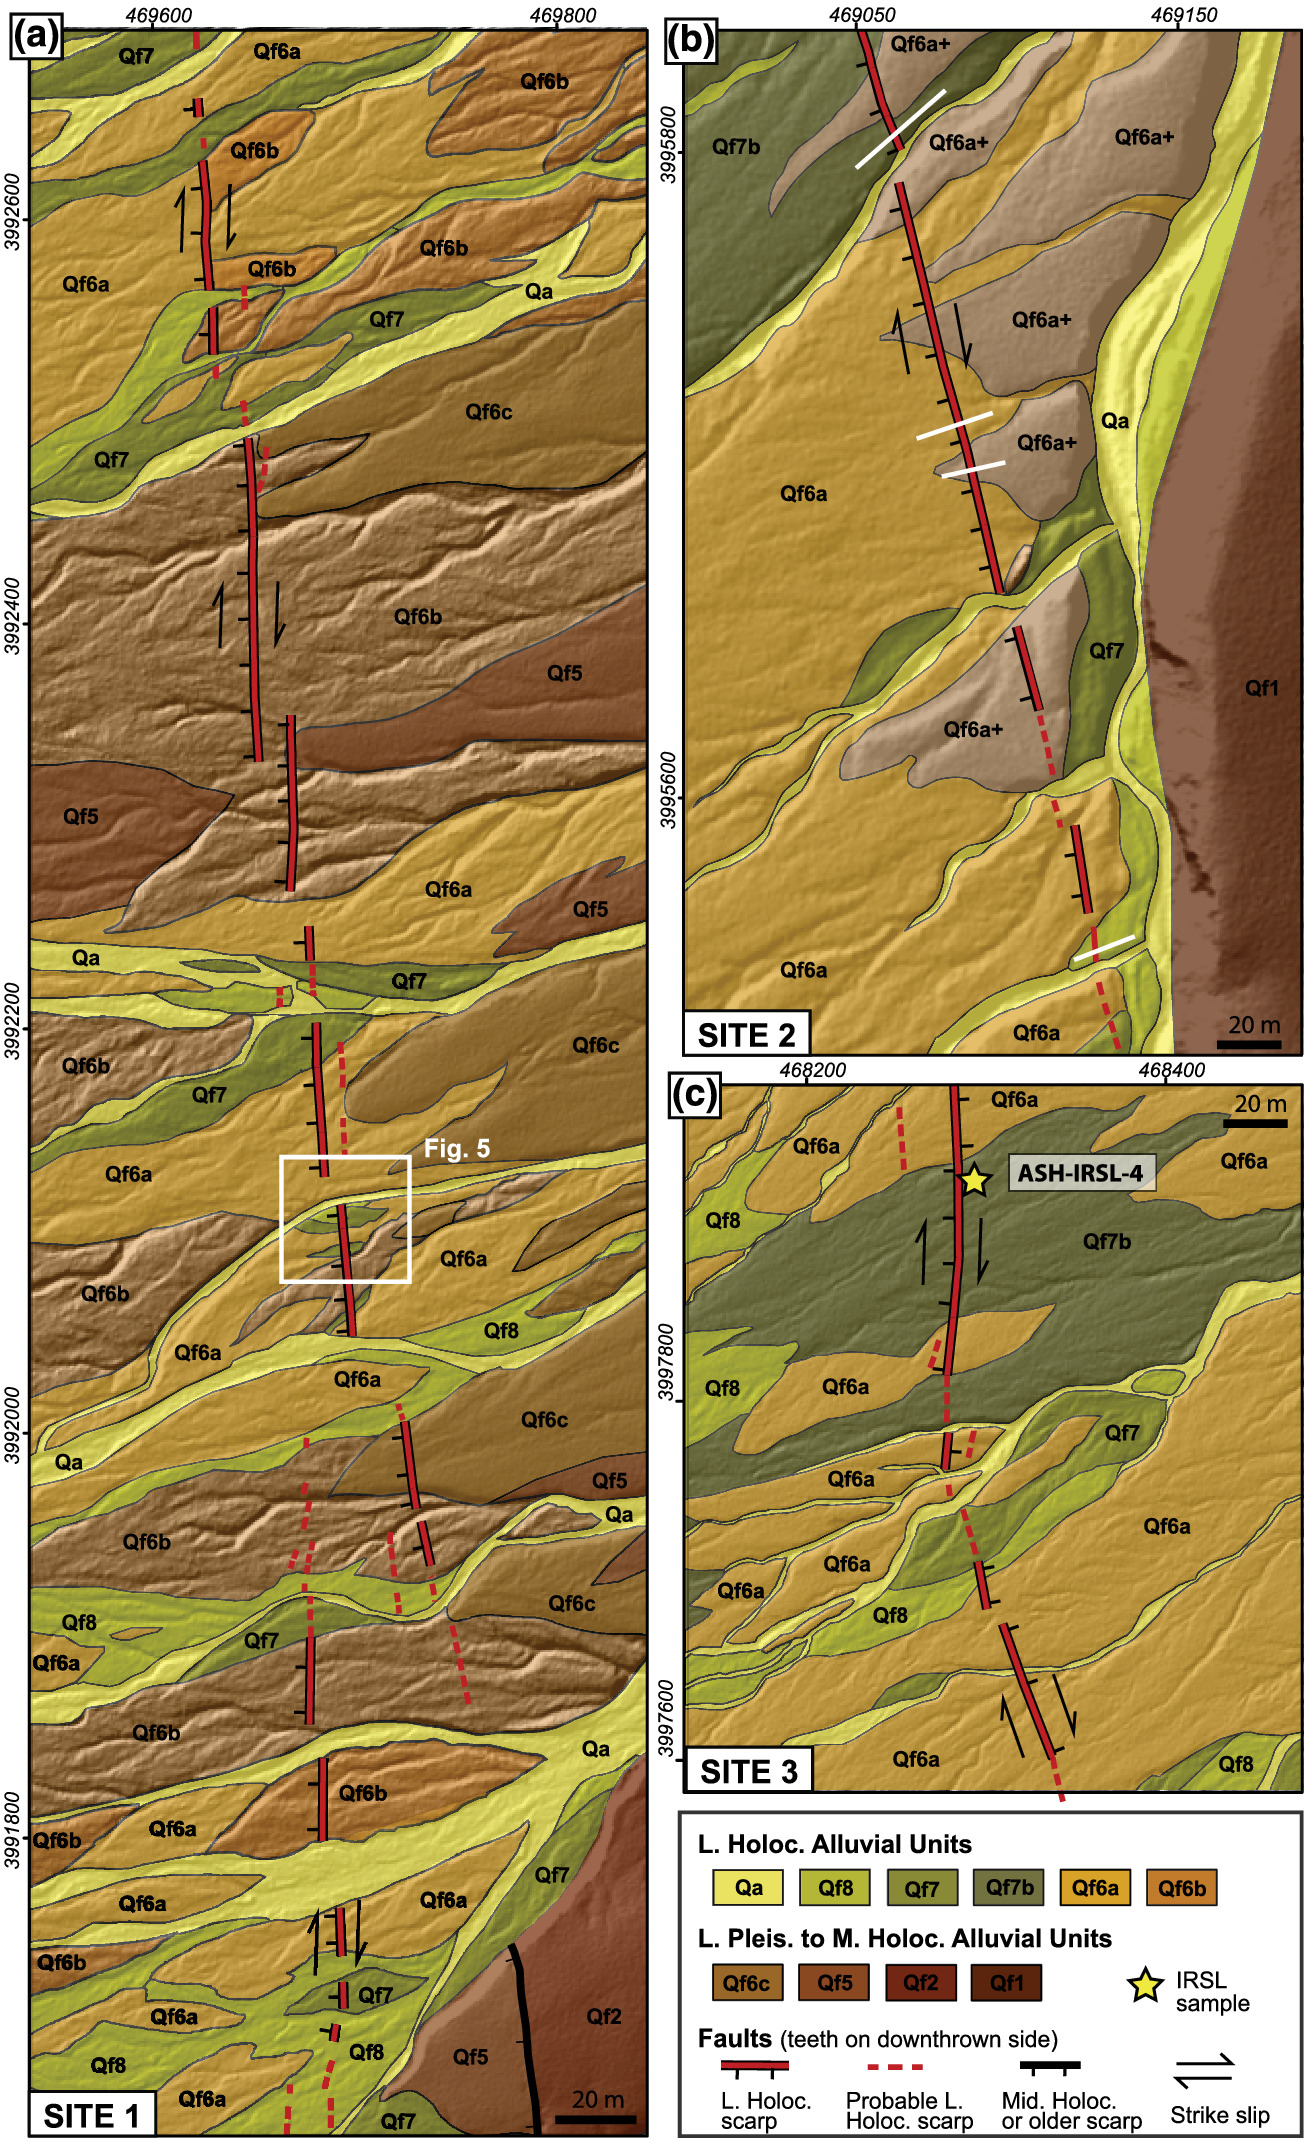
Producing an archive of past earthquake activity on faults in Eastern California is critical for evaluating the potential interaction between different faults during large earthquakes. Regalla et al. documented the earthquake record of the Ash Hill fault of Eastern California over the last 12,000 years. They used lidar data along the fault to map local and regional surface features produced by past earthquake activity, and they generated a new high resolution digital surface model using drone-based Structure-from-Motion (SfM) photogrammetry. These surface observations combined with dating of sediments revealed that three earthquakes ruptured the ground surface in the last 4,000 years. Each earthquake produced approximately one meter of slip, or movement of the ground surface. This fault and nearby faults ruptured at the time, suggesting that the large earthquake ruptured adjacent faults during the same event.
- Publication: Regalla, C., Kirby, E., Mahan, S., McDonald, E., Pangrcic, H., Binkley, A., ... & Lynch, E. M. (2022). Late Holocene rupture history of the Ash Hill fault, Eastern California Shear Zone, and the potential for seismogenic strain transfer between nearby faults. Earth Surface Processes and Landforms. https://doi.org/10.1002/esp.5432

Surficial geologic maps for portions of the southern Ash Hill fault. Mapping was compiled from field observations, interpretation of aerial imagery, and lidar DEMs. Figure from Regalla et al. (2022).
Redistributing sediment in small mountain streams with dams
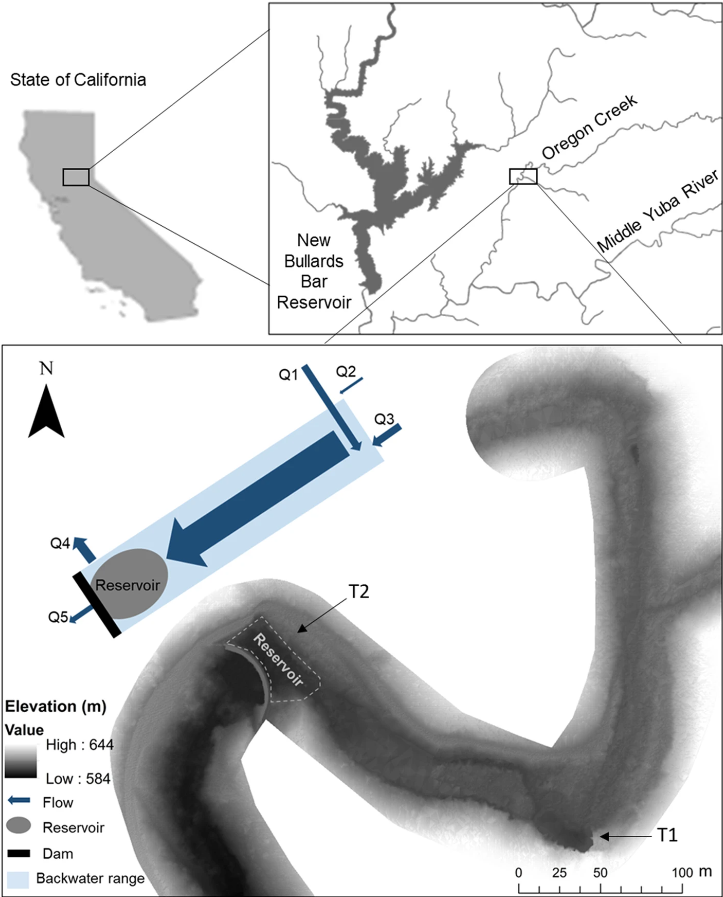
There are over 90,000 dams in the United States, the vast majority of which are small dams that impede water and sediment movement, which impact downstream ecology and hydrology. Li and Pasternack evaluated a method that could help redistribute and transport sediment trapped in reservoirs behind dams to a specific area. The authors used a study site in north-central California with seasonally low to no flow to model how transferring water across and within watersheds by tunnels can erode and redistribute sediment in dammed streams. They used a lidar digital elevation model from the Sierra Nevada Mountains to provide the base topography for modeling. In modeling different amounts of water transferred to the reservoir, they found that sediment erosion increased by over 100% when this water transfer flow was maximized, a flow 12 times higher than the average annual river flow. These results show that transferring water between reservoirs can help to redistribute deposited sediments, particularly to areas where they may be easier to excavate and remove.
- Data used: 2014 USFS Tahoe National Forest Lidar
- Publication: Li, T., & Pasternack, G. B. (2022). Water Transfer Redistributes Sediment in Small Mountain Reservoirs. Water Resources Management, 1-16. https://doi.org/10.1007/s11269-022-03290-2

Location of the case study stream, stream network map, study reach topography, and simplified schematic showing locations of the reservoir, backwater range, inflows (Q1, Q2, and Q3), and outflows (Q4, Q5). Figure from Li and Pasternack (2022).
OpenTopography is supported by the U.S. National Science Foundation to facilitate access to topographic data for Earth and other scientific research and education. We closely track peer-reviewed publications that utilize OpenTopography data and services as they are an important measure of our impact.
Have a new paper out that uses data or services provided by OpenTopography and want us to highlight it in a future blog post? Drop us a note: info@opentopography.org
