Highlight: January-May 2022 publications using OpenTopography hosted datasets
By Emily Zawacki
OpenTopography is supported by the U.S. National Science Foundation to facilitate access to topographic data for Earth and other scientific research and education. We closely track peer-reviewed publications that utilize OpenTopography data and services as they are an important measure of our impact. To better highlight new results that demonstrate the use and reuse of OpenTopography data and processing, we will periodically be featuring new results in a blog post.
Have a new paper out that uses data or services provided by OpenTopography and want us to highlight it in a future blog post? Drop us a note: info@opentopography.org
Insights into debris flows from topographic differencing
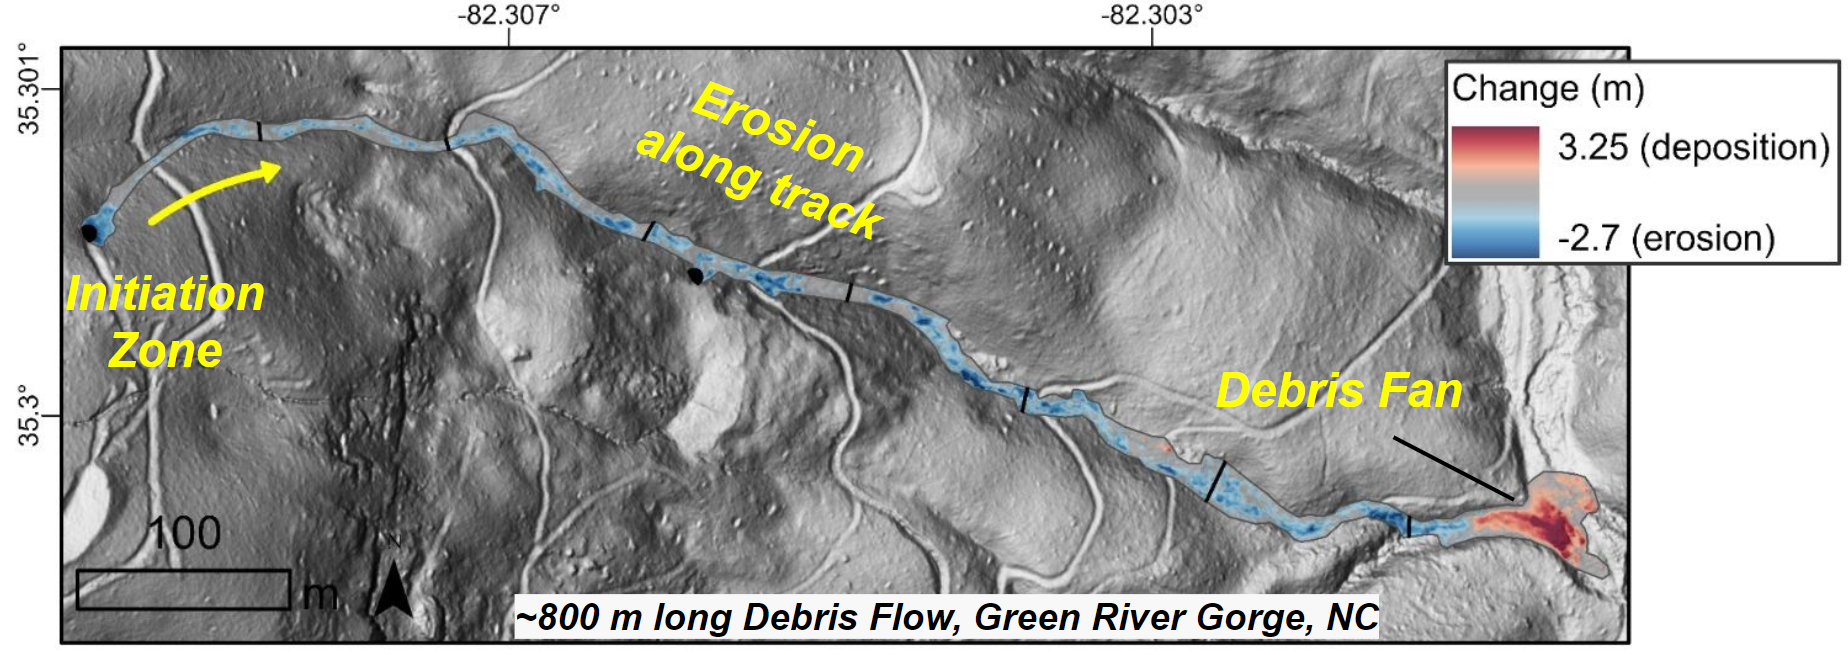
Debris flows are destructive landslides that can be triggered by intense rain storms. Lidar data provides a way to characterize the erosion and deposition from debris flows. In this study, the authors used lidar data to map 54 debris flows that occurred during a storm on May 18, 2018 in Polk County, North Carolina. The storm produced 150 mm of rain within 3 hours and triggered at least 240 landslides. The researchers compared pre-event lidar collected in 2017 with post-event lidar collected in 2020 to develop a digital elevation model of difference (DoD) and observe elevation changes. The DoD highlights areas of erosion (negative change) and deposition (positive change) along the path of the debris flow. The largest detected change was 5.5 m of erosion. The authors found that debris flows that originate in larger drainage areas can travel for longer distances down slope. Thus, these debris flows can travel across more gentle slopes before they transition from generating erosion to deposition.
- Research article: Scheip, Corey, and Karl Wegmann (2022). Insights on the growth and mobility of debris flows from repeat high-resolution lidar. Landslides, 19, 6, p. 1297-1319. https://doi.org/10.1007/s10346-022-01862-2.
Image Credit: Dr. Corey Scheip. Change detection image from a ~800 m long debris flow in the Green River Gorge section of the study area. The debris flows targeted were from May 18, 2018.
Rare geologic features provide clues about large past earthquakes
Fragile geologic features, such as precariously balanced rocks and rock pillars, are records of ground shaking in past earthquakes. In this study, the authors examined fragile geologic features along and inland from the Oregon coastline. The Pacific Northwest last experienced a megathrust earthquake (magnitude >9) in 1700 C.E, and these fragile geologic features provide information about older earthquakes that have few other records. To understand the shaking conditions that it would take for the fragile features to fall, the authors characterized the shape, size, mass, and rock strength of the fragile features. They used lidar data to measure sea stacks—columns of rock in the sea—which are otherwise difficult to access, in addition to other rock pillars. From the lidar point cloud, the authors determined the volume and estimated the mass of the sea stacks. Many of the fragile geologic features likely experienced at least two megathrust earthquakes and thus can be used to assess past earthquake shaking and future hazards.
- Research article: McPhillips, Devin, and Katherine M. Scharer (2022). Survey of fragile geologic features and their quasi‐static earthquake ground‐motion constraints, southern Oregon. Bulletin of the Seismological Society of America, 112, 1, p. 419-437. https://doi.org/10.1785/0120200378.
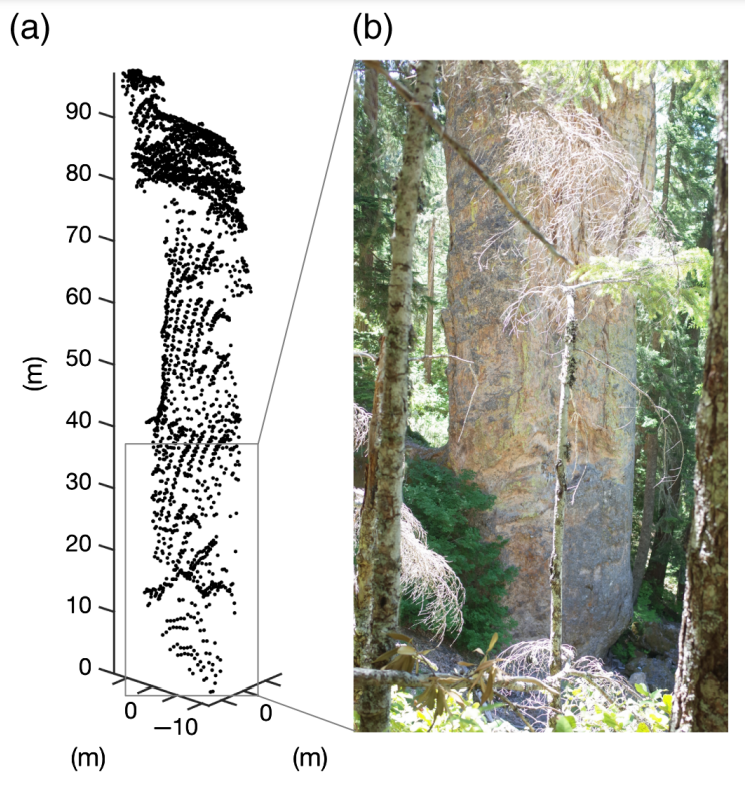
A fragile geologic feature inland from the Oregon coast with the corresponding lidar point cloud (left) used to estimate its size and shape. Figure from McPhillips et al. (2022).
Using deep learning to extract bare earth surface representations
Extracting a digital terrain model (DTM), which represents the bare ground surface, from a digital surface model (DSM), which represents the upper elevations of a landscape, can prove difficult when there are densely forested and steep regions. The authors of this study presented a framework for directly generating a DTM from a DSM based on deep learning without detecting non-ground points. The authors chose lidar datasets from different cities and locations across the U.S with varying surface characteristics to implement and evaluate their extraction approach. Their DTM extraction approach outperformed existing algorithms, even in challenging regions such as forested slopes. Their direct extraction approach resulted in higher accuracy due to the fact that it prevents error aggregation during various processing steps seen in other approaches.
- Data used:
- Post Hurricane Harvey Mapping of the Mission River, Texas 2018
- UMD-NASA Carbon Mapping /Sonoma County Vegetation Mapping and LiDAR Program
- Southwest Flank of Mt. Rainier, WA
- St. Elias Mountains and Gulf of Alaska
- State of Utah Acquired LiDAR Data - Wasatch Front
- Research article: Amirkolaee, Hamed Amini, Hossein Arefi, Mohammad Ahmadlou, and Vinay Raikwar (2022). DTM extraction from DSM using a multi-scale DTM fusion strategy based on deep learning. Remote Sensing of Environment, 274, 113014. https://doi.org/10.1016/j.rse.2022.113014.
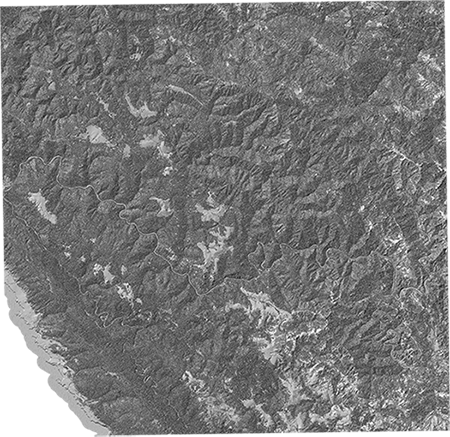
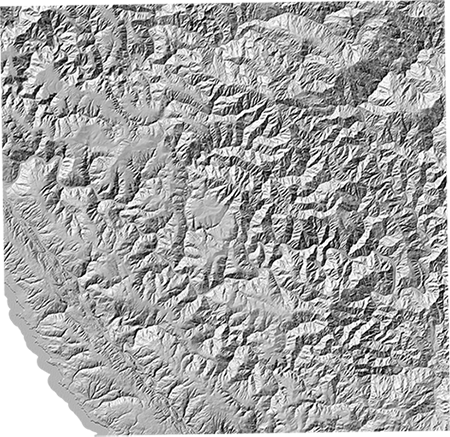
Digital surface model (DSM) [left] and digital terrain model (DTM) [right] of Sonoma County, California generated on OpenTopography.
Using topography to evaluate communication networks in Chaco Canyon, New Mexico
The construction of great houses in Chaco Canyon, New Mexico, between 850-1200 CE required large coordinated labor pools. In this study, the authors explored great house construction and the availability of workers through the perspective of communication speeds between communities. They used a digital elevation model (DEM) from lidar data over the Chaco Canyon region to analyze the most time-efficient walking paths between great houses. They found that someone could walk the entire network of great houses within Chaco Canyon in a few hours or less, with great houses outside the Canyon requiring upwards of 8-20 hours to walk between them. Given how long it would take for messengers to travel between groups, the authors suggested that labor for building the great houses primarily came from agricultural communities that were at most a three hour walk from the largest buildings in Chaco Canyon. Beyond this time range, there would likely be too much time lost to farming at home and scheduling conflicts due to unpredictable water availability.
- Research article: Wills, W. H., Paulina F. Przystupa, and Katharine Williams (2022). Communication in the Chaco World: A consideration of time and labor mobilization. American Antiquity, p. 1-30. https://doi.org/10.1017/aaq.2022.33.
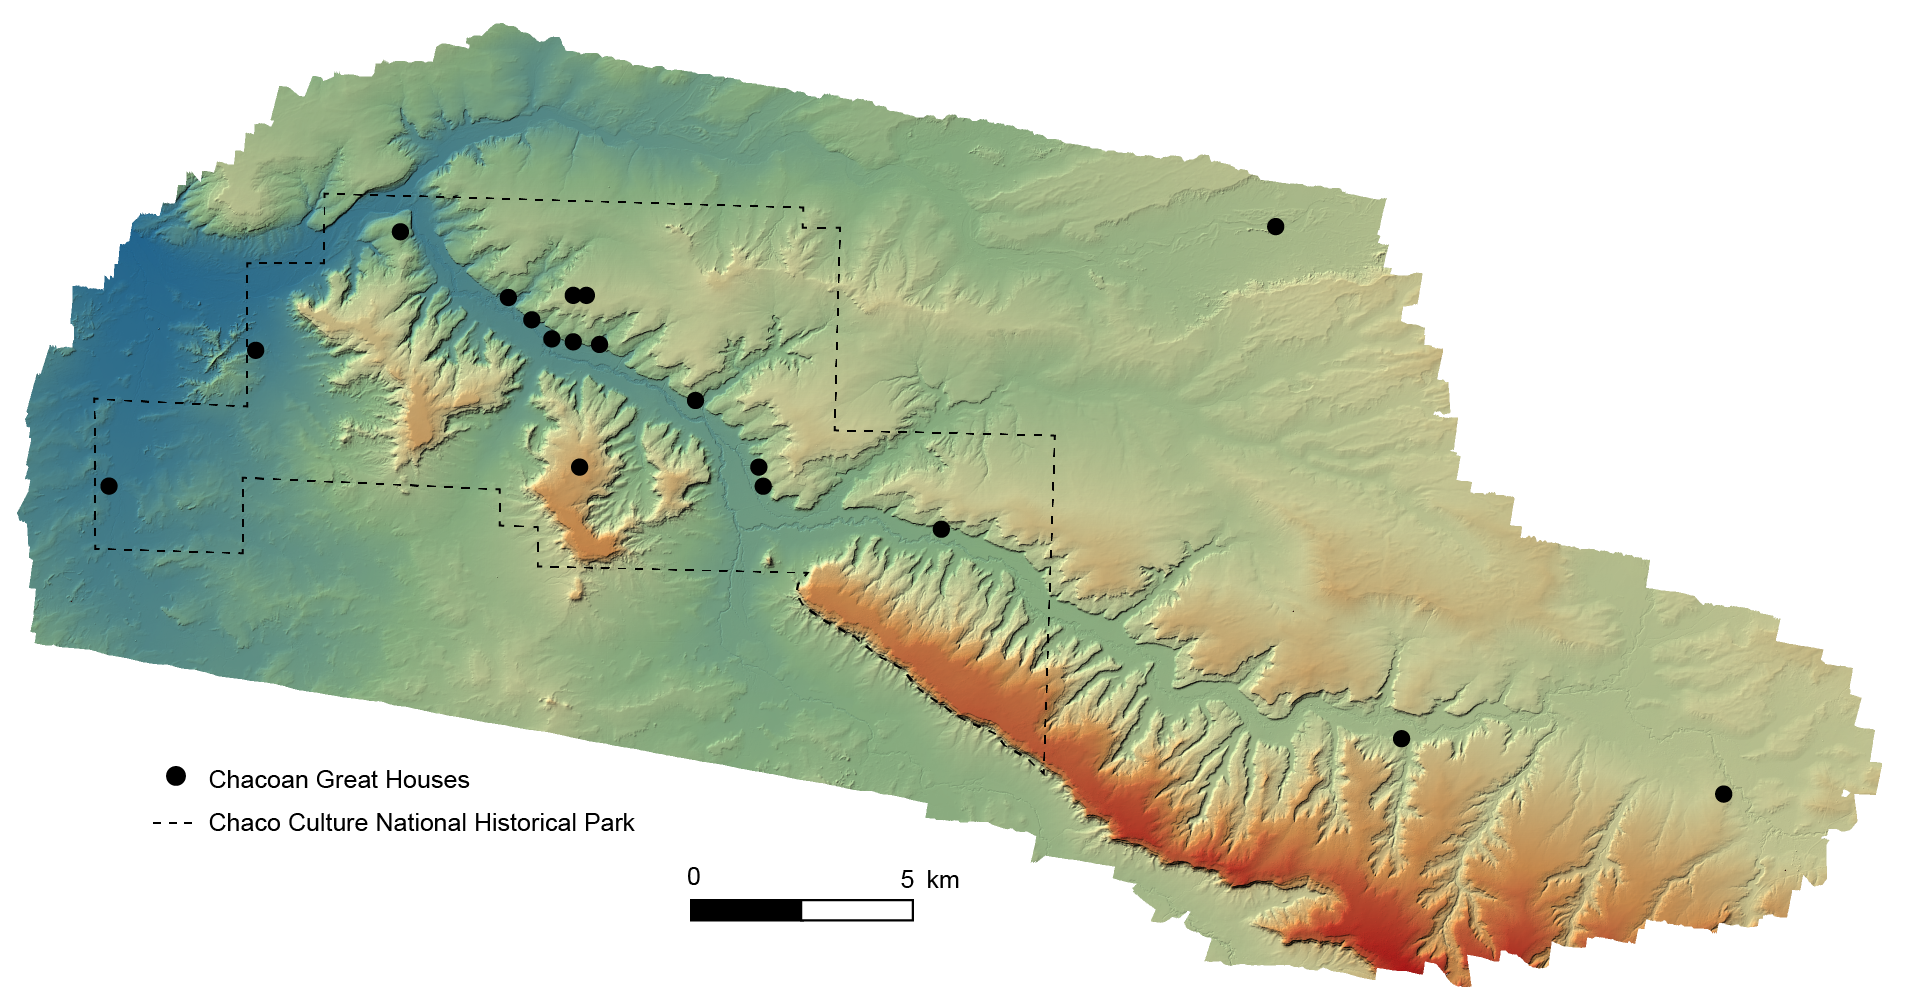
Digital elevation model (DEM) of the Chaco Canyon region with locations of great houses in the Chaco Core. The study authors determined the time and most efficient path to walk between great house locations.
All publications that cite OpenTopography data can be found on our Google Scholar page.

