2018 Kilauea Volcano Datasets Available for Download
OpenTopography is pleased to announce the availability of lidar point cloud data from the Kilauea volcano, Hawaii, USA from early June, 2018 and July, 2018 following the beginning of its most recent activity on May 3, 2018. Funded by the USGS (June) and the State of Hawaii and the Federal Emergency Management Agency (FEMA) (July), these data acquisitions cover, respectively, three and five regions heavily impacted by the 2018 eruption, including Kilauea Summit and East Rift Zone. Together with the 2009 Hawaii Big Island Lidar Survey, these data offer a rare "before and after" view of one of the world's most volcanically active regions and present an opportunity to constrain topographic change resulting from the volcanic event. The June 2018 data were collected by GEO1 and Windward Aviation via Quantum Spatial, Inc. The July 2018 data were collected by National Center for Airborne Laser Mapping in partnership with Cold Regions Research and Engineering Laboratory. Datasets were obtained from the USGS Kilauea LiDAR website. Please refer to that site for additional information.
Get the data:
2009 Hawaii Big Island Lidar Survey
Kilauea Volcano, HI June 2018 Acquisition
Kilauea Volcano, HI July 2018 Acquisition (updated to version 2 of the dataset, July 30, 2018)
Comparison between the 2009 (5.01 pts/m2point cloud) Triangulated Irregular Network (TIN) Digital Elevation Model (DEM) (1 m resolution) and recently released early July, 2018 aerial lidar (18.13 pts/m2) TIN DEM (0.5 m resolution), colored by elevation and each draped over their respective hillshades, at Halemaʻumaʻu Crater at Kilauea's summit with aerial imagery background. Graphic updated July 30, 2018.

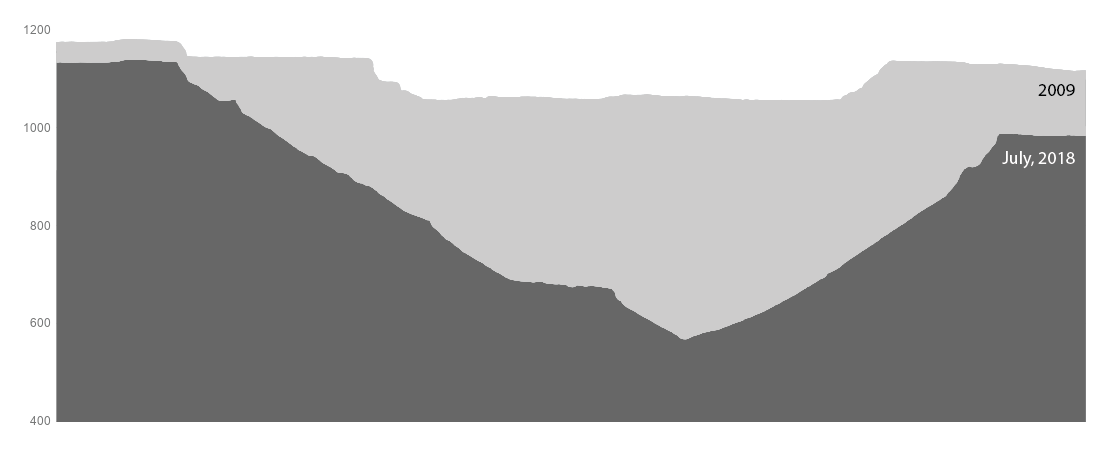
Topographic profile, from west to east, through the center of the Halemaʻumaʻu Crater comparing the 2009 data (light gray) and July, 2018 data (dark gray) illustrates the magnitude of subsidence in 2018. Graphic updated July 30, 2018
