TauDEM processing on OpenTopography
Topographic rasters produced from OpenTopography's high-resolution point clouds can be used in tandem with TauDEM, an open source analysis toolkit by Dr. David Tarboton at Utah State University, to extract hydrologic information from topography. TauDEM can perform calculations such as flow direction and area contributing to a point within the hydrologic network. This capability has previously been demonstrated using Hydrology tools in Arc's Spatial Analyst toolbox (see this 2008 example) or using TauDEM's command line tools or Arc toolbox extension. However, hydrologic analysis on large, high resolution raster datasets is computationally challenging. OpenTopography integrated TauDEM into our raster processing suite to enable users to take advantage of high performance computing resources at the San Diego Supercomputing Center to perform hydrologic analysis. Presently, TauDEM in OpenTopography runs on the Gordon supercomputer, an NSF XSEDE funded machine for data-intensive computing at SDSC. Learn more about TauDEM and HPC computing in this paper.
Mt. Rainier Hydrological Network Example
Beginning November 5, 2006, Mt. Rainier National Park received 18 inches of rainfall in 36 hours, causing flash flooding and major damage to the park's infrastructure. We can visualize the event in Google Earth using rasters created from the "Southwest Flank of Mt.Rainier, WA" dataset, collected in 2012, and TauDEM tools on OpenTopography.
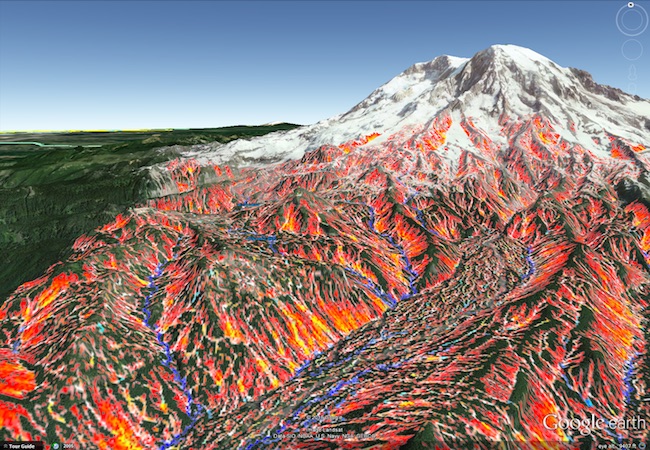
Google Earth visualization of the Mount Rainier hydrologic network. Red areas represent a catchment area of 100 m2 while blue areas represent an area of > 610,000 m2. Kautz Creek flows through the large valley near the center of the image. The creek, like many on Mt. Rainier, is primarily fed by a glacier. Kautz Creek is no stranger to flood events, but floods are usually caused by glacier outbursts and not heavy rain.
The usually high amount of rain caused Kautz Creek to overflow its narrow channel. Coupled with a buildup of debris, the creek jumped its banks and changed course approximately one mile up the mountain from Nisqually-Paradise Rd., the park's primary point of access. Kautz Creek was now flowing through heavily wooded terrain before reaching the road and flowing over, making it impassable. The creek's new path brought it past the road 350 meters east of the bridge built to cross it.
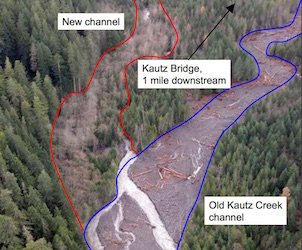
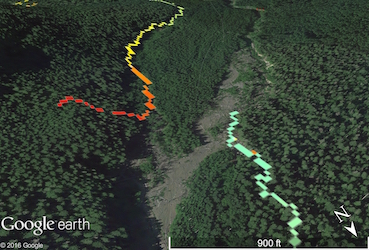
Left: Aerial view of Kautz Creek's old and new channels. Photo: NPS. Right: Stream channel calculated by TauDEM. The new stream channel is shown in orange-yellow.
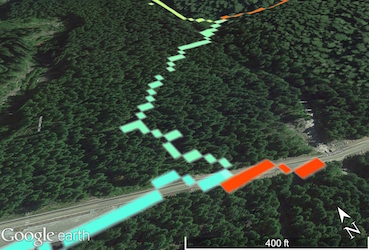
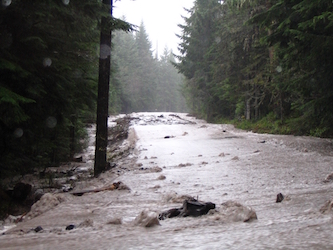
Left: Drainage network along the new Kautz Creek channel, crossing the road. The actual channel is slightly east of that calculated. Two 12-foot diameter culverts were placed to allow the road to cross over the creek's new channel. The 30-meter long bridge to the west now crosses a mostly dry stream bed. Right: Kautz Creek flowing over Nisqually-Paradise Rd. during the storm. Photo: NPS
In addition to flowing over, and eventually partially washing out Nisqually-Paradise Rd., Kautz Creek's new channel continued along a service road toward the park's only permanent helibase (heliport) and a maintenance yard. The network calculated by TauDEM closely follows the service road and directly crosses the helibase. The service road has since been rebuilt, but the helibase may be relocated from its flood-prone location.
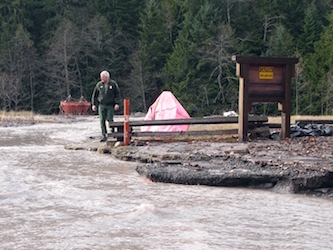
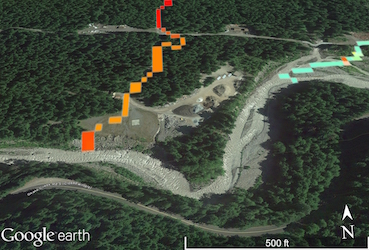
Left: The helibase and its access road were severely washed out before Kautz Creek finally reached the Nisqually River. Photo: NPS. Drainage network running through the Kautz Helibase access road.
Google Map showing old and new Kautz Creek channels and damage.
Using TauDEM tools in OpenTopography
You must register and login in order to access the TauDEM tools on OpenTopography. If this is your first time accessing TauDEM, you must go to your user account settings, click "Update Profile / Change Password / Enable Services," then the "Advanced Processing Services" tab. Ensure that "TauDEM Services" is checked and click update to confirm.
Now, navigate to the job submission form for your dataset of interest. This example features the "Southwest Flank of Mt.Rainier, WA" point cloud dataset. Select the largest area possible. Processing can be done over much larger areas on raster datasets compared to point cloud datasets. For the Mt. Rainier example, however, a new DEM was generated from the point cloud. The standard 1 meter resolution raster provided through OpenTopography produces a very complicated hydrologic network at Mt. Rainier. The network can be simplified by providing a lower resolution raster to TauDEM. In the example above, the resolution was set at 10 meters. This is specified under "Gridding Parameters" on Step 3A.
In Step 6, select the TauDEM products you wish to produce. The Mt. Rainier example features Google Earth visualizations of a "D-Infinity Specific Catchment Area" raster. Click the box and the other TauDEM products required for the area raster will be automatically checked. Now, submit the job and let OpenTopography create your rasters at blazing speed!
For some finishing touches, additional processing can be done to colorize and normalize the raster. OpenTopography Project Co-I Ramon Arrowsmith has produced a series of walkthrough videos on producing drainage networks in ArcGIS and visualizing the results in ArcScene. You can join the walkthrough at the 2:59 mark since the prior steps are now handled by OpenTopography.
Additional information:
