Creating 2D and 3D Visualizations with Rayshader
Nat Quinn, OpenTopography 2021 summer intern

Recently, OpenTopography has seen considerable growth in users leveraging our data combined with tools such as rayshader, an open source package for producing 2D and 3D data visualizations in the R software environment, to create beautiful visualizations of landscapes. We didn't want to miss out on the fun, so we created a Jupyter Notebook (also available in RStudio format) for OpenTopography users to explore and learn about rayshader. The rayshader package utilizes a combination of raytracing, hillshading methods, and overlay imagery to produce 2D and 3D visualizations and maps. Within our notebook, a variety of options and features are explored, however, please see the full package documentation as many more features are available.
 |
|
| Two views of Crested Butte, Colorado | |
To get users started, and to streamline access to data, the notebook calls the USGS 3DEPElevation Image Service to retrieve lidar-derived digital elevation models (DEMs) and the World Imagery satellite service to retrieve aerial imagery. These APIs can provide data from anywhere within the United States.
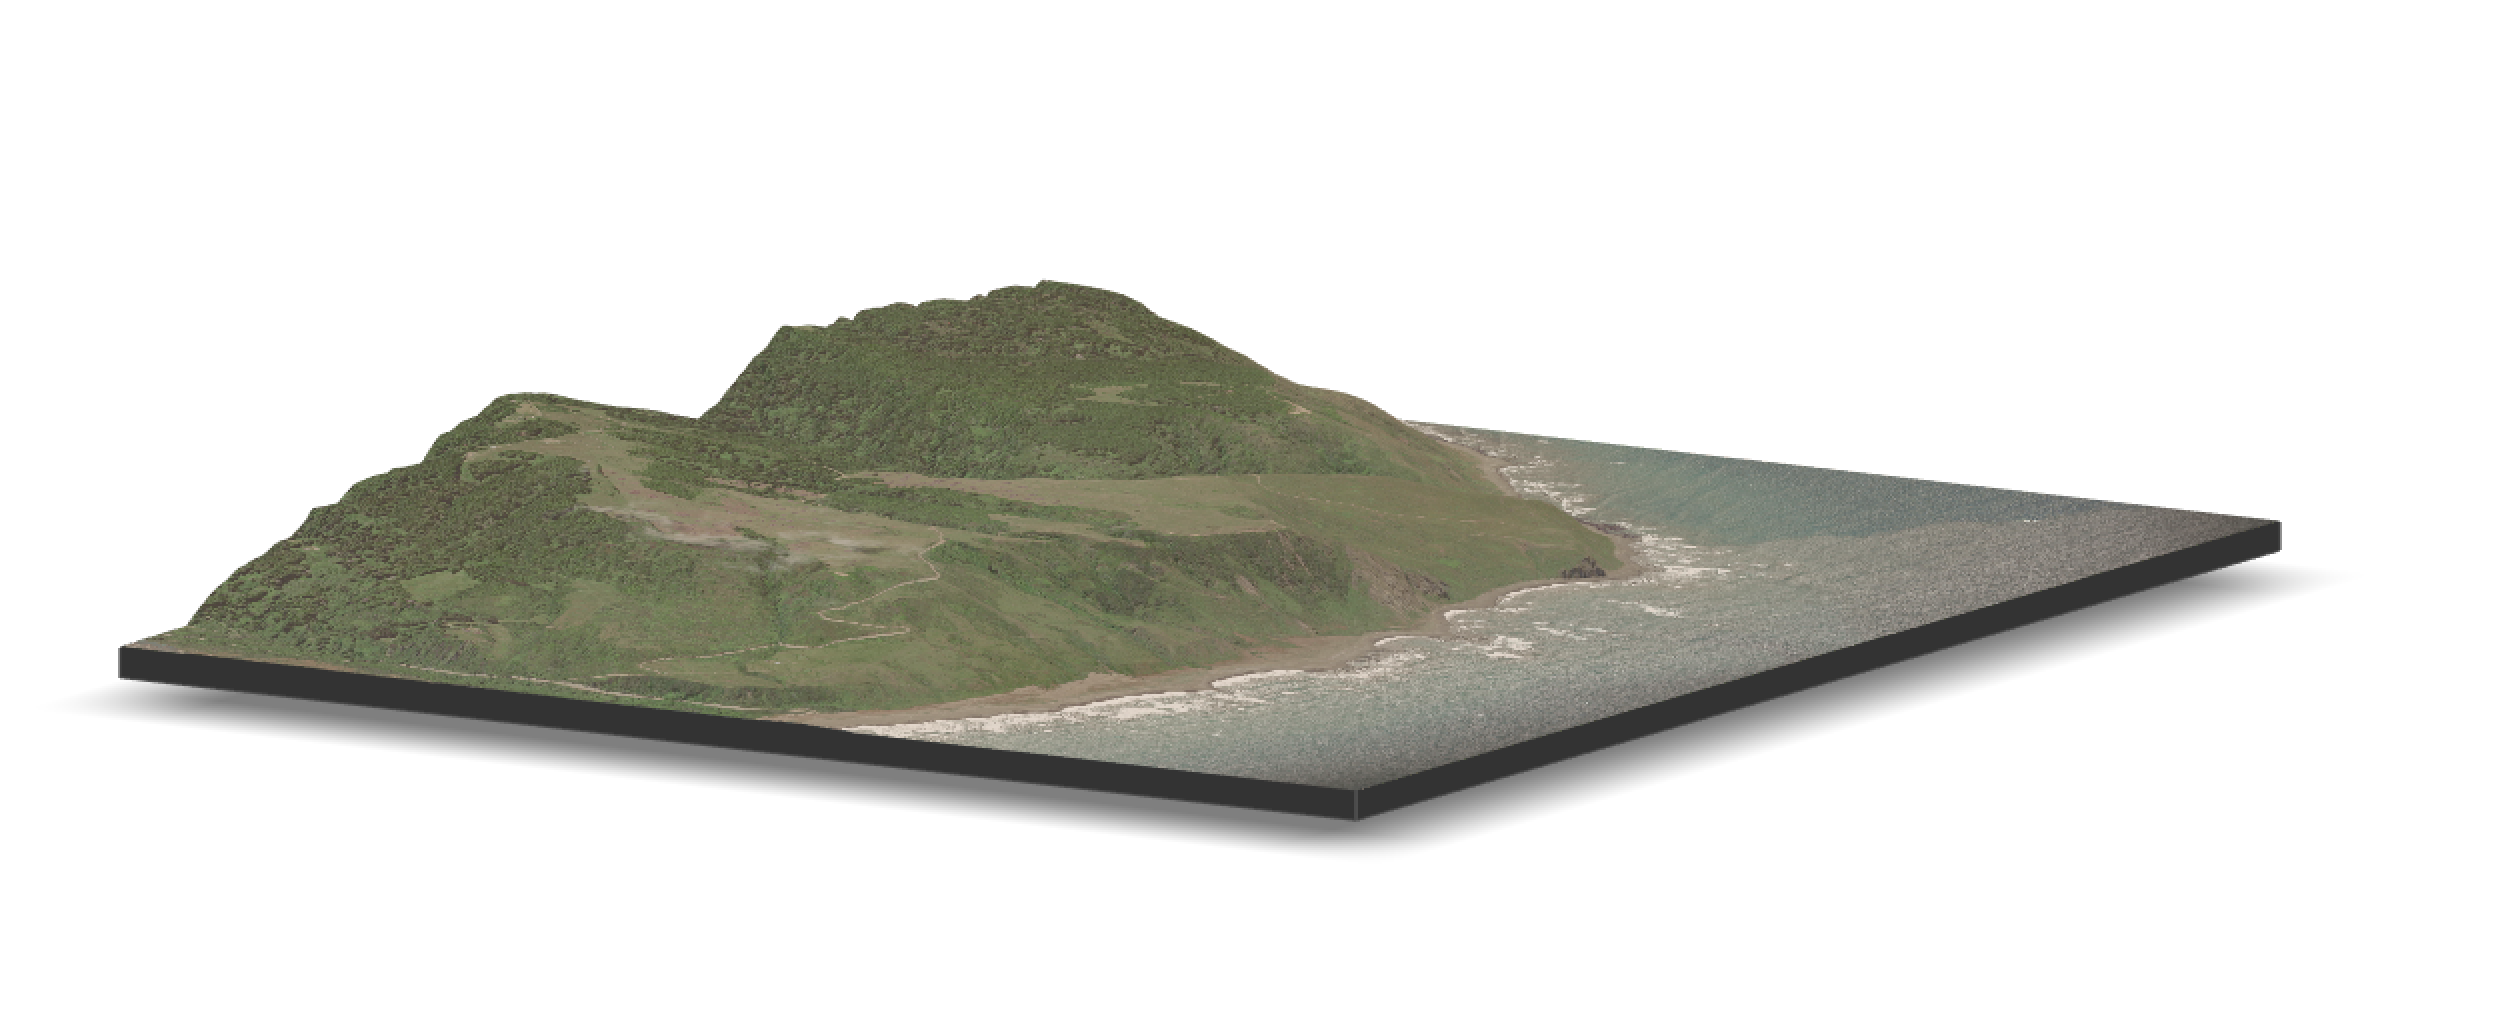
Kings Range in northern California
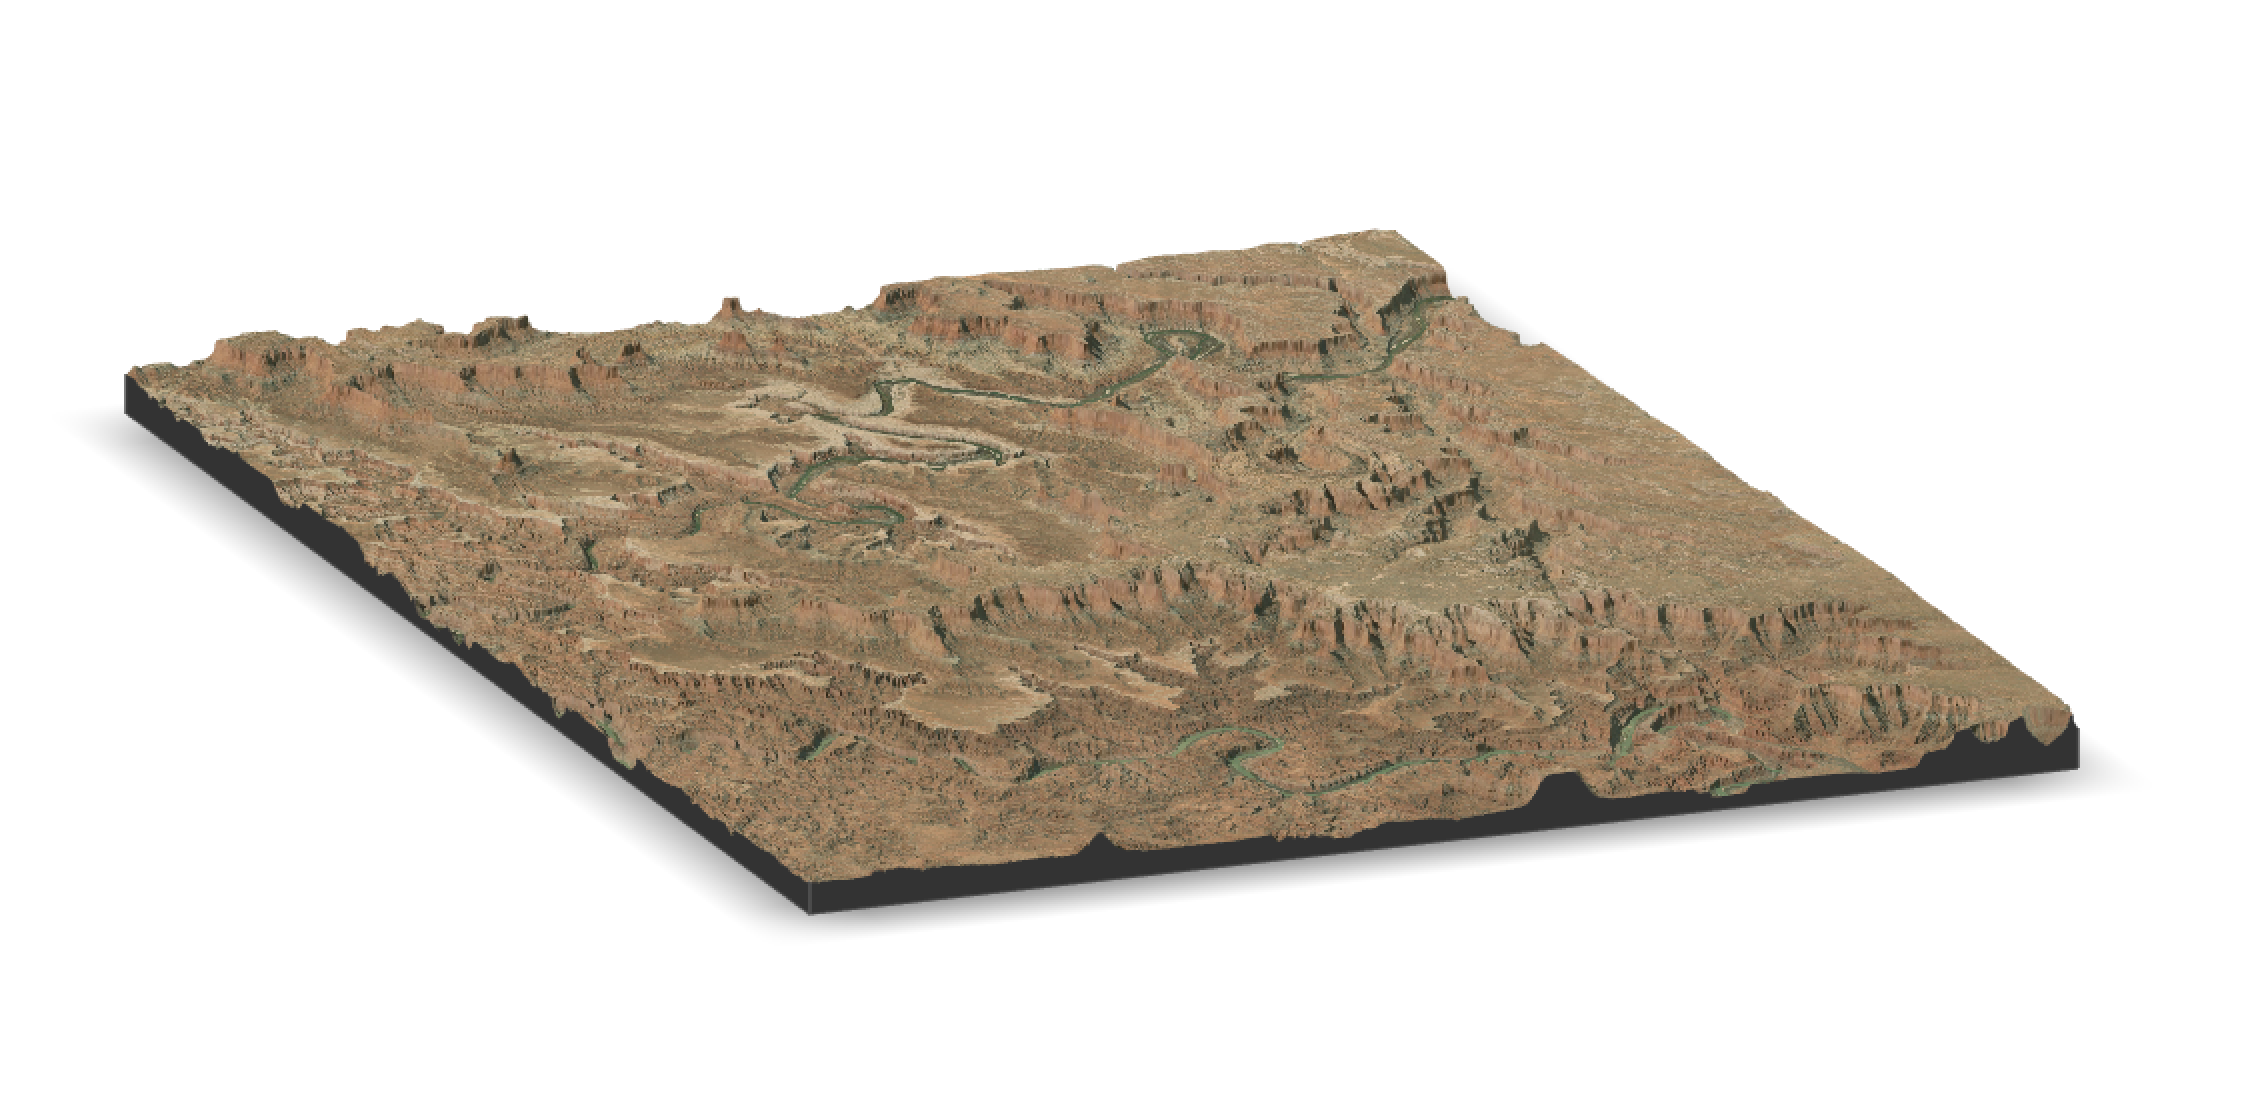
Canyonlands, Utah
After loading all necessary datasets, the notebook outputs a 2D or 3D rendering of the requested location. Many inputs regarding lighting, shading, overlay transparencies, etc. are defaulted to author tested settings but can be adjusted per user needs. We encourage experimentation and exploration!
 |
 |
| Mount Hood, Oregon | Grand Tetons, Wyoming |
We hope this notebook gives users a resource to get started and imagine the many potential use cases for lidar and imagery overlay visualizations using tools such as rayshader. Dive into the the Jupyter Notebook HERE.


