New Raster Visualization Tools in OpenTopography
We recently released a completely new version of OpenTopography's raster (i.e., digital elevation models (DEM)) visualization service. Raster visualization was one of the oldest processing services in OpenTopography, and it's very valuable for quickly and easily getting an overview of the requested topographic data. We're happy to announce that the new version was rewritten to improve performance and expand the number of derivative products and visualizations that are available. The new raster visualization service will generate hillshade and color-relief maps, with user control over illumination angle and color palettes. In addition, standard topographic metrics of slope, aspect, and roughness are available. Users can access these data products as browse images, full resolution images, GIS friendly formats such as GeoTIFF and IMG, and Google Earth compatible KMZ format. Development of the new OpenTopography raster visualization service was led by summer 2022 USIP intern Kenneth Larrieu.
The following examples illustrate the new raster visualization features. Results are shown for a subset of the USGS 3DEP 1m dataset over the Little Missouri River in the Badlands of North Dakota, USA.
Hillshade
In addition to the previously existing ability to make hillshades with user controlled illumination angle, multidirectional hillshades can now be generated, which emphasize topographic variation in each direction as opposed to a fixed light source. Also, a vertical exaggeration scale factor can be specified, which helps increase shading for smaller topographic variations in relatively flat terrain.
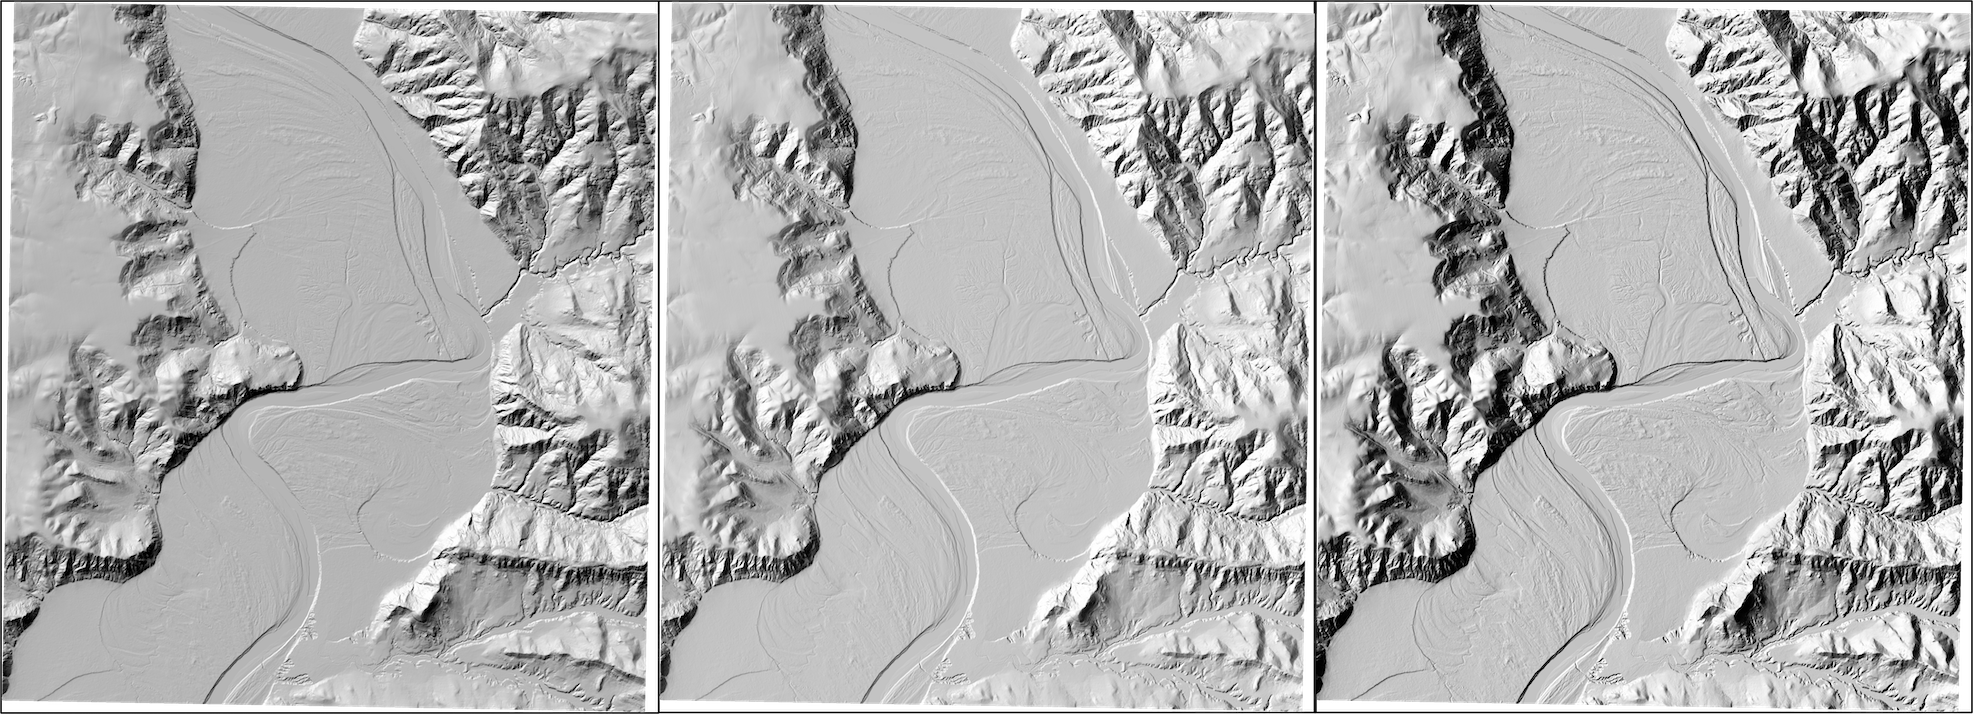
From left to right: standard (directional hillshade, sun to the NW), multidirectional hillshade, and multidirectional hillshade with a 2x vertical exaggeration factor.
Color-relief
Color-relief rasters apply a color palette to the range of elevation values in the selected dataset. Several color palettes are now available to choose from, including colorblind friendly palettes.
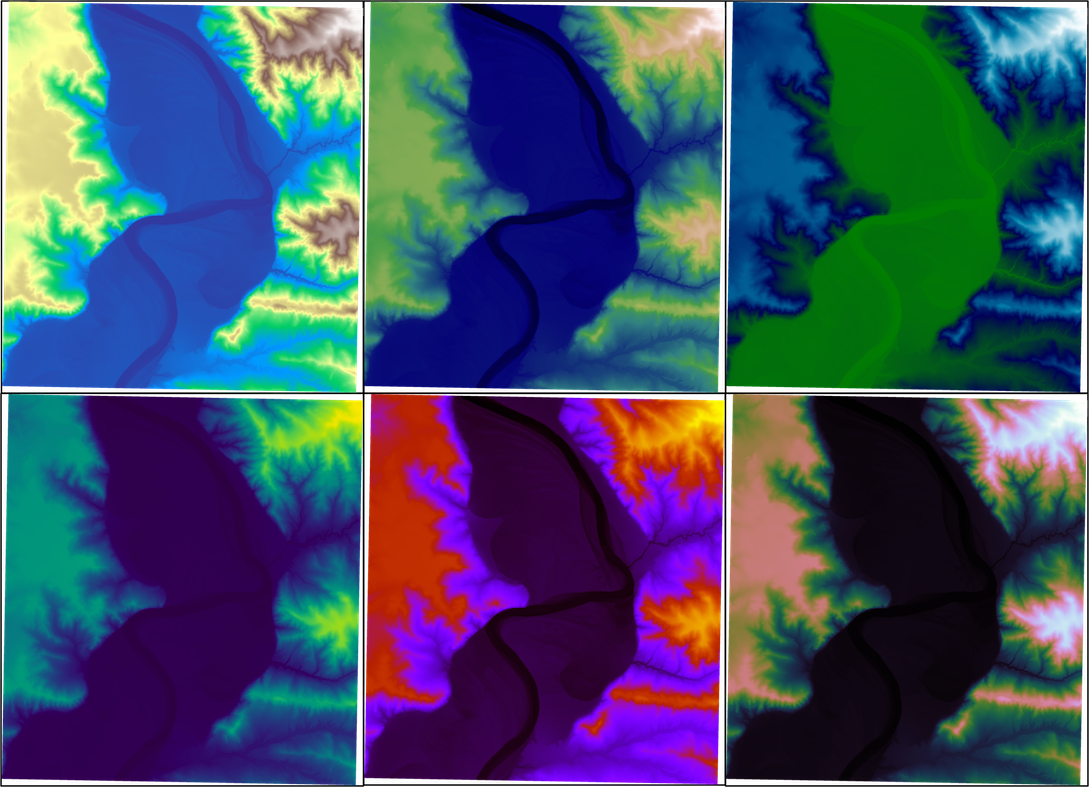
Left to right, top to bottom: Color-relief maps with color palettes "terrain", "gist_earth", "ocean", "viridis", "gnuplot", and "cubehelix".
Hillshade color
The hillshade and color-relief rasters can be blended to create a map with color representing the elevation and shading to emphasize local topographic differences.
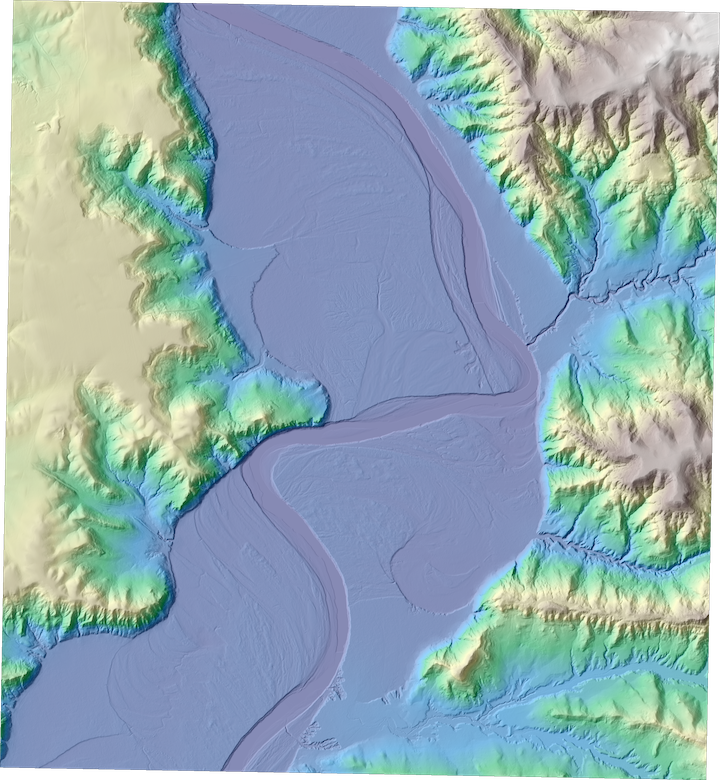
A hillshade color map, made by blending a multidirectional hillshade with a color-relief map ("terrain" color palette).
Slope, Aspect, and Roughness
The local slope (0-90 degrees), aspect (0-360 degrees), and roughness of the terrain can also be calculated.
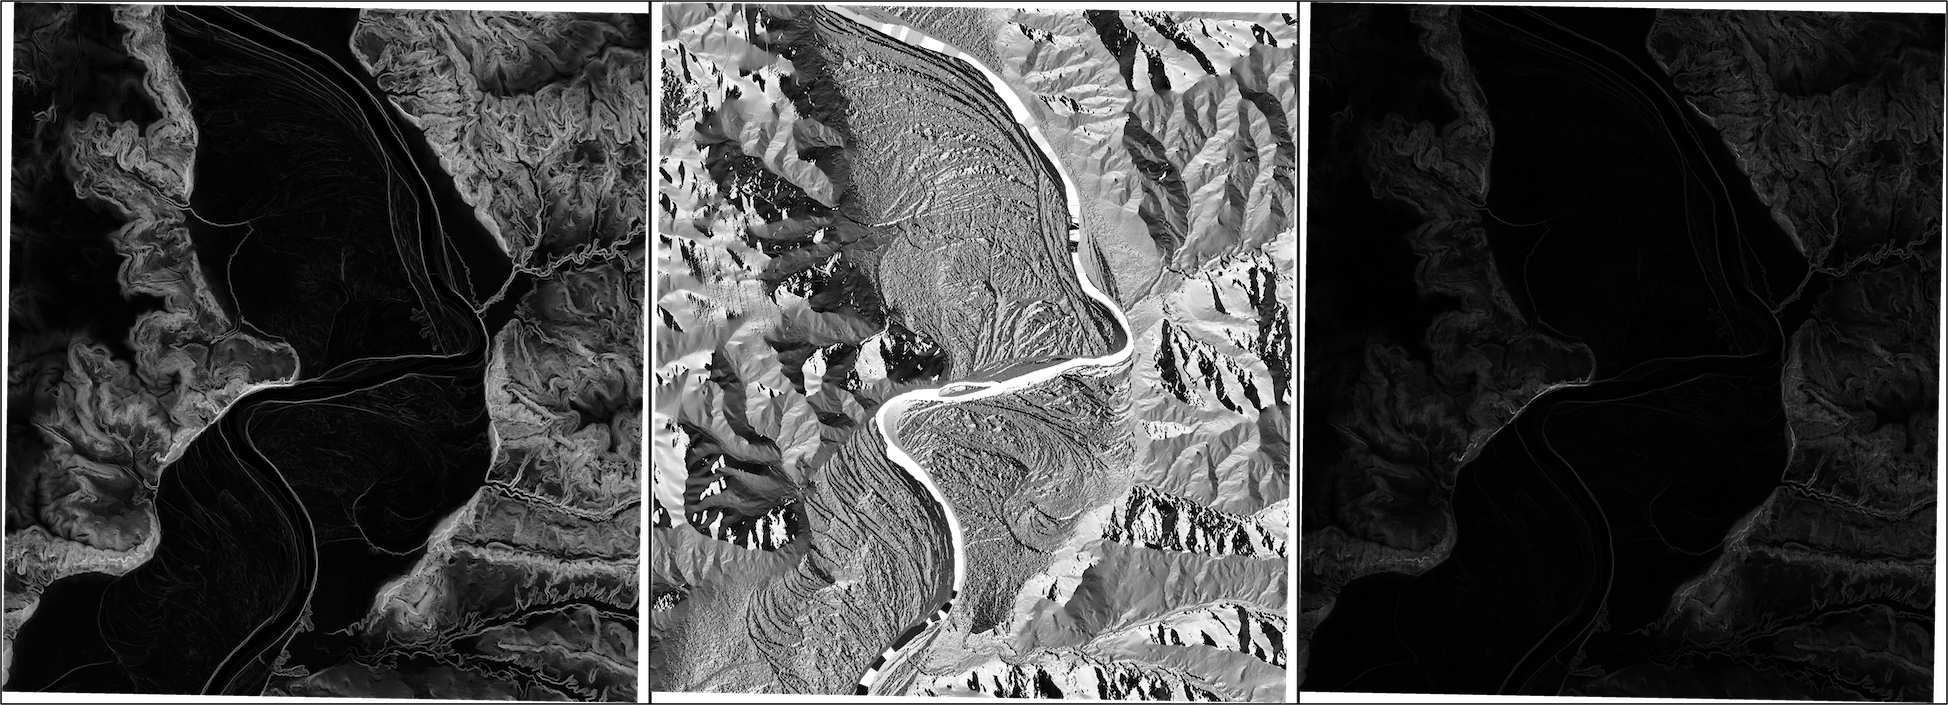
Left to right: slope, aspect, and roughness maps.
Output formats
In addition to (PNG) image outputs, these rasters can also be output in GeoTIFF (.tif) or IMG format (suitable for viewing in GIS software), or additionally in KMZ format (easily viewed in Google Earth).
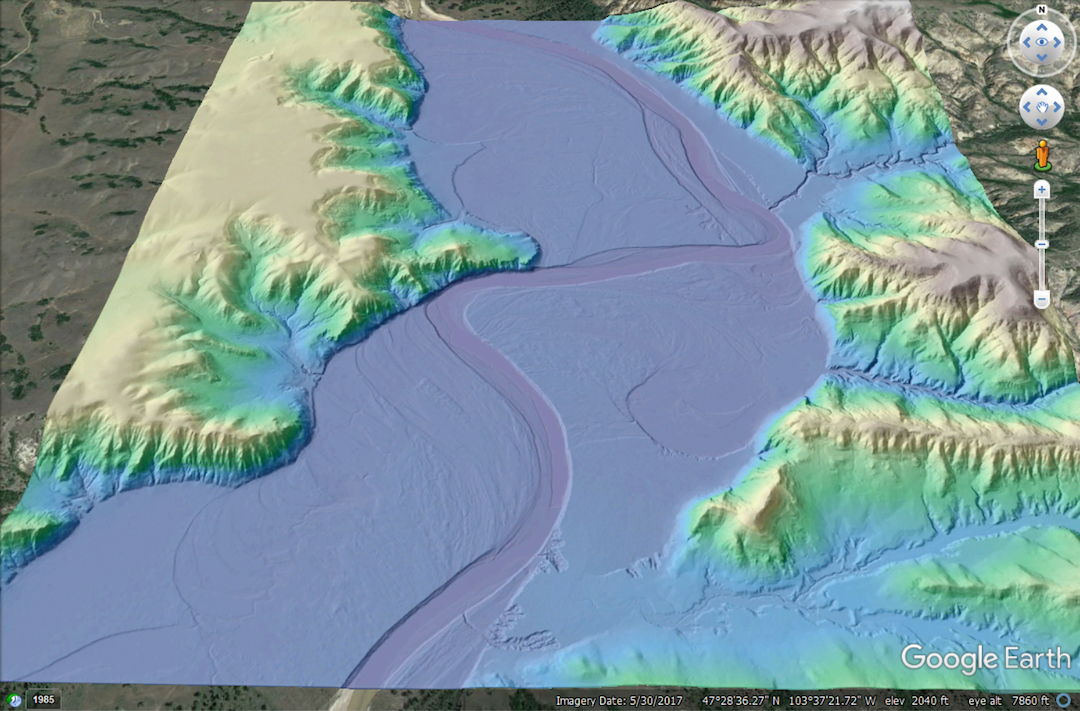
The previously shown hillshade color map output in KMZ format and opened with Google Earth.
