The National Association of Geoscience Teachers (NAGT) ranked this exercise as 'exemplary' and host it here.
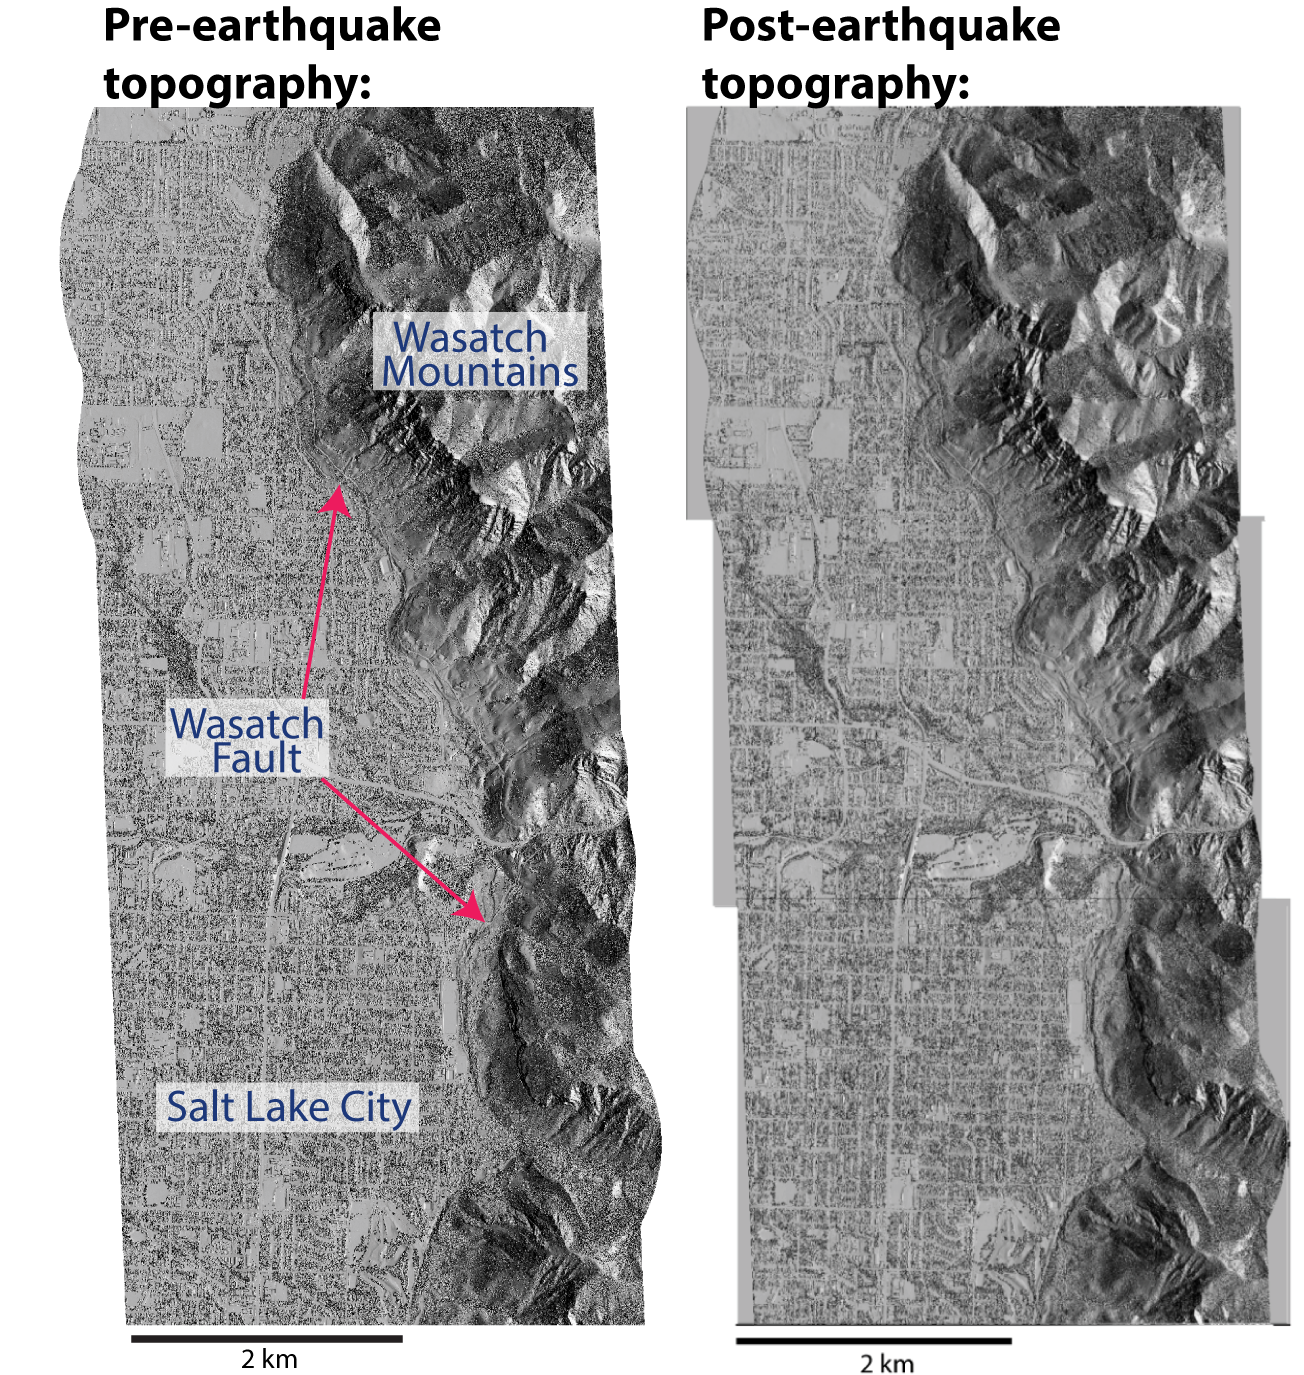
After a big earthquake happens people ask, ‘Where did the earthquake occur? How big was it? What type of fault was activated.’ We have designed an undergraduate laboratory exercise where students learn how geologists and geodesists use airborne lidar topography data to answer these questions for a synthetic earthquake along the Wasatch Fault in Salt Lake City, Utah. Students use high resolution topography data to measure how much and in what direction the ground moved during the earthquake. They explore classical faulting relationships by estimating the earthquake magnitude and determining the type of fault activated (e.g., normal, reverse, strike-slip). In addition, students learn about the hazard and scientific response required for large surface rupturing earthquakes and are exposed to cutting-edge technology for working with topography data.
 Learning goals: (1) Students visualize how earthquakes permanently deform landscapes. (2) Students describe the relationship between fault slip, surface displacement, and earthquake magnitude. (3) Students interpret quantitative geospatial datasets. They relate their measurements of surface displacement to the type of fault activated. (4) Students practice writing scientific methods and interpretations for an experiment with uncertainty.
Context for use: This laboratory exercise is intended for an intermediate to advanced level undergraduate course. The exercise can be used in the faulting section of a course on structural geology, geomorphology, geophysics, or geohazards. A remote sensing course with students in a variety of majors is also appropriate provided additional time can be spent on the introductory material. The exercise is designed to fit within a four hour period (or three hours if the introductory lecture is done in advance). Most students will complete exercise write-up as homework. The laboratory assignment includes some pencil and paper mapping. Students will need a laptop or access to a computer lab.
Material Provided: We provide a background presentation with relevant material on earthquakes, lidar remote sensing, and topographic differencing.
Pre-laboratory lecture The lab handout contains a topographic hillshade where students map the Wasatch fault, a table where students record their surface displacement measurements, and a figure that relates surface displacement to the earthquake magnitude. There is a set of questions for students to answer following the lab.
Lab Handout Several high resolution topography datasets that simulate topography before and after a large synthetic earthquake along the Wasatch fault, Utah. These can be easily visualized and manipulated in Cloud Compare. This exercise can be performed with any of the tiles below. Each contain a pre- and post- high resolution topography dataset.
Pre- and Post-Earthquake high resolution topography data: North tile
Pre- and Post-Earthquake high resolution topography data: Middle tile
Pre- and Post-Earthquake high resolution topography data: South tile
Pre- and Post-Earthquake high resolution topography data: Small tile
Student video describing how to calculate surface displacements from topography
We also provide a video for students (and instructors) that describes how to calculate 3D coseismic surface displacements from high resolution topography. The instructor video goes over the answers to the laboratory exercise is available by contacting Chelsea Scott (cpscott1@asu.edu).
Acknowledgements: Chelsea Scott was supported by NSF Postdoctoral Fellowship 1625221 and by the School of Earth and Space Exploration at Arizona State University.
